
Over the past couple of months I have written about major breadth warnings in the stock market, deteriorating fundamental conditions indicated by the “inside of the stock market” and how investors were not embracing risk in way that would be supportive of sustained gains. In adding to that last point, I want to share a longer-term perspective today that highlights just how important these long-term divergences can be.
The chart below plots the S&P 500 along with a simple measure of equity market risk appetites (the consumer discretionary-to-consumer staples ratio), volatility (VIX) and corporate bond spreads (BBB-rated). Normally, all of these things should move in sync. As stock prices move higher they should be supported by rising risk appetites, falling volatility and falling corporate spreads. When these indicators diverge, it can be a good early warning sign that the environment is changing and prices are about to reverse lower.
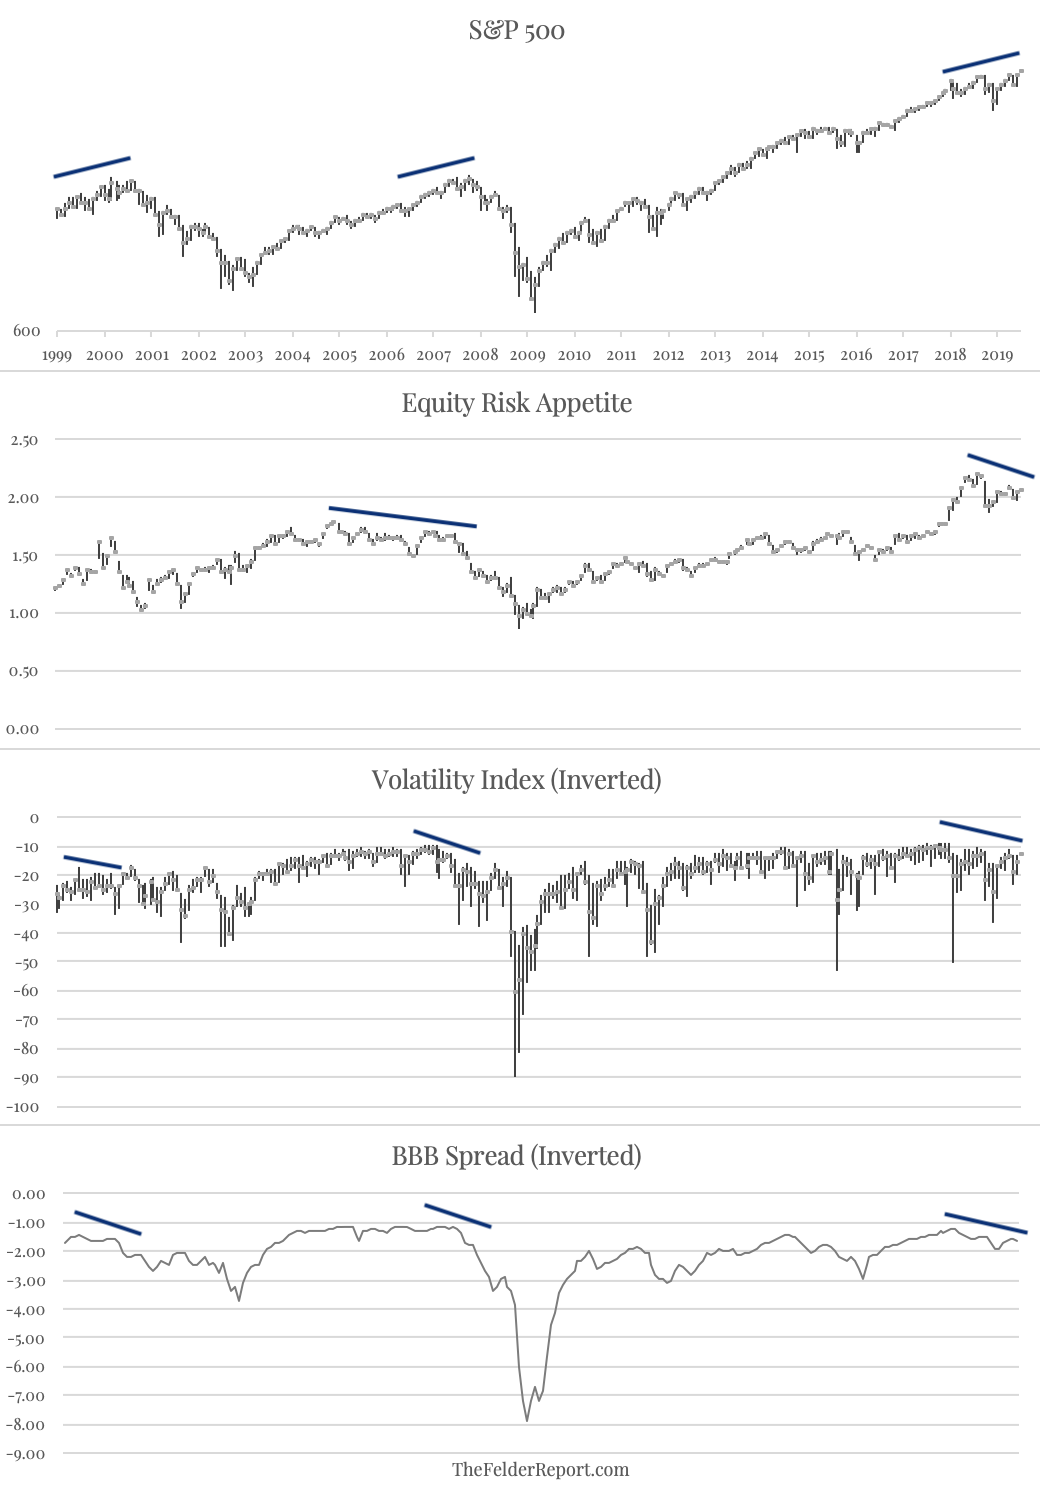
At the March 2000 price peak in the S&P 500, though this measure of equity market risk appetite didn’t diverge from prices, both volatility and spreads did. At the 2007 price peak, all three were flashing this warning signal. They did for a time again in 2015 before the August flash crash that year and the plunge in stock price in early-2016. Once again, all three of these indicators are diverging from prices suggesting something may be changing in the investing environment and long-term investors should be cautious at present.
Sir John Templeton famously said, “Bull markets are born on pessimism, grown on skepticism, mature on optimism and die on euphoria.” In my view, these indicators of risk appetites across the equity, options and fixed income space, help to visualize that point in time when optimism and euphoria are exhausted and the trapdoor to lower stock prices is opened by a major shift back towards risk aversion. This may be another one of those times.