Stan Druckenmiller recently gave a wide-ranging interview at the Economic Club of New York. One of the insights he shared that I found most valuable was this:
'By far the best economic predictor I've ever met is the inside of the stock market. I don't mean the stock market. I mean the inside of the stock market.' -Stan Druckenmiller https://t.co/1RvsRLdszG
— Jesse Felder (@jessefelder) June 5, 2019
The quote continues:
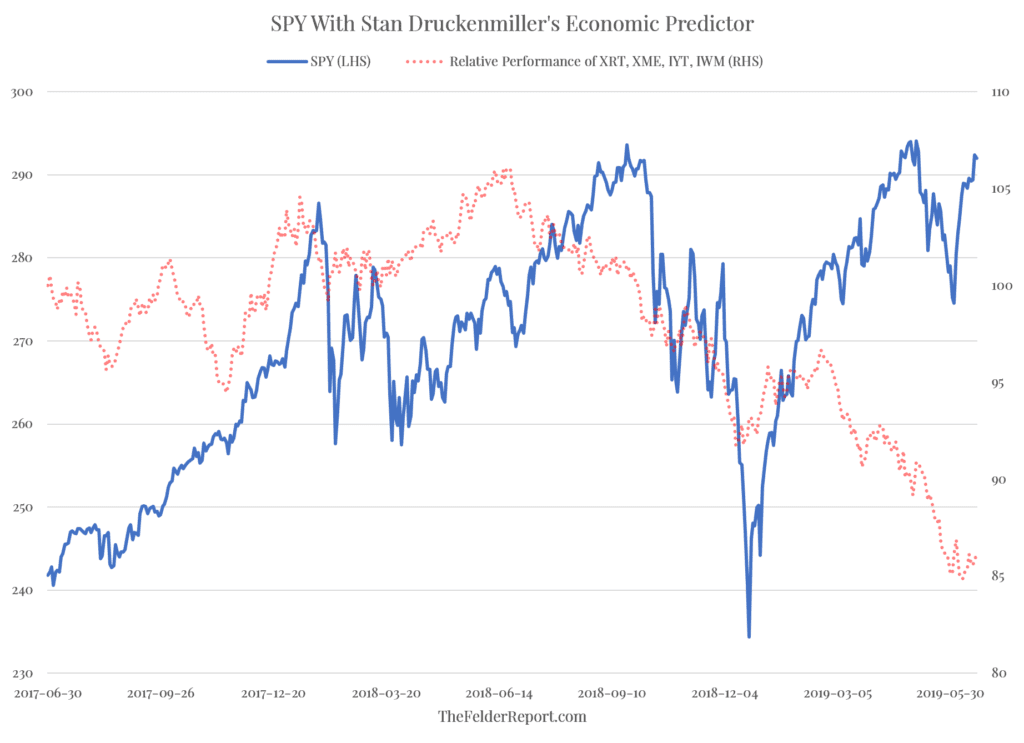
By far the best economic predictor I’ve ever met is the inside of the stock market. I don’t mean the stock market. I mean the inside of the stock market. And that’s looking at cyclical companies within the stock market. And I particularly like, ’cause it tends to be the right kind of timing, trucking, retail, that kind of stuff, the Russell 2000. So if you just look at the periods I’ve analyzed generally those stocks start going down and defensive stocks and secular growth stocks start going up on a relative basis… The XRT, the retail index, is down 24% since the high in August… The Russell 2000 is down 15% with a lot of breadth in that decay. The S&P metals is down 20%… All that stuff is at 52-week relative lows and all the companies you would analyze that probably do about the same in a 1% nominal economy as at 3% – they’re all at relative highs… So the inside of the stock market right now is not saying, “we’re gonna be in recession,” but it’s saying, “you better be careful and keep your eyes open.”
This section of the discussion was especially compelling to me because I have been playing around with different indicators in this regard for a while now (see: Investors Aren’t Embracing Risk The Way Equity Bulls Should Hope). So I thought it would be fun to create an indicator that puts this concept into a visual chart form. Below is the result of this effort.
“You better be careful and keep your eyes open,” indeed.


