
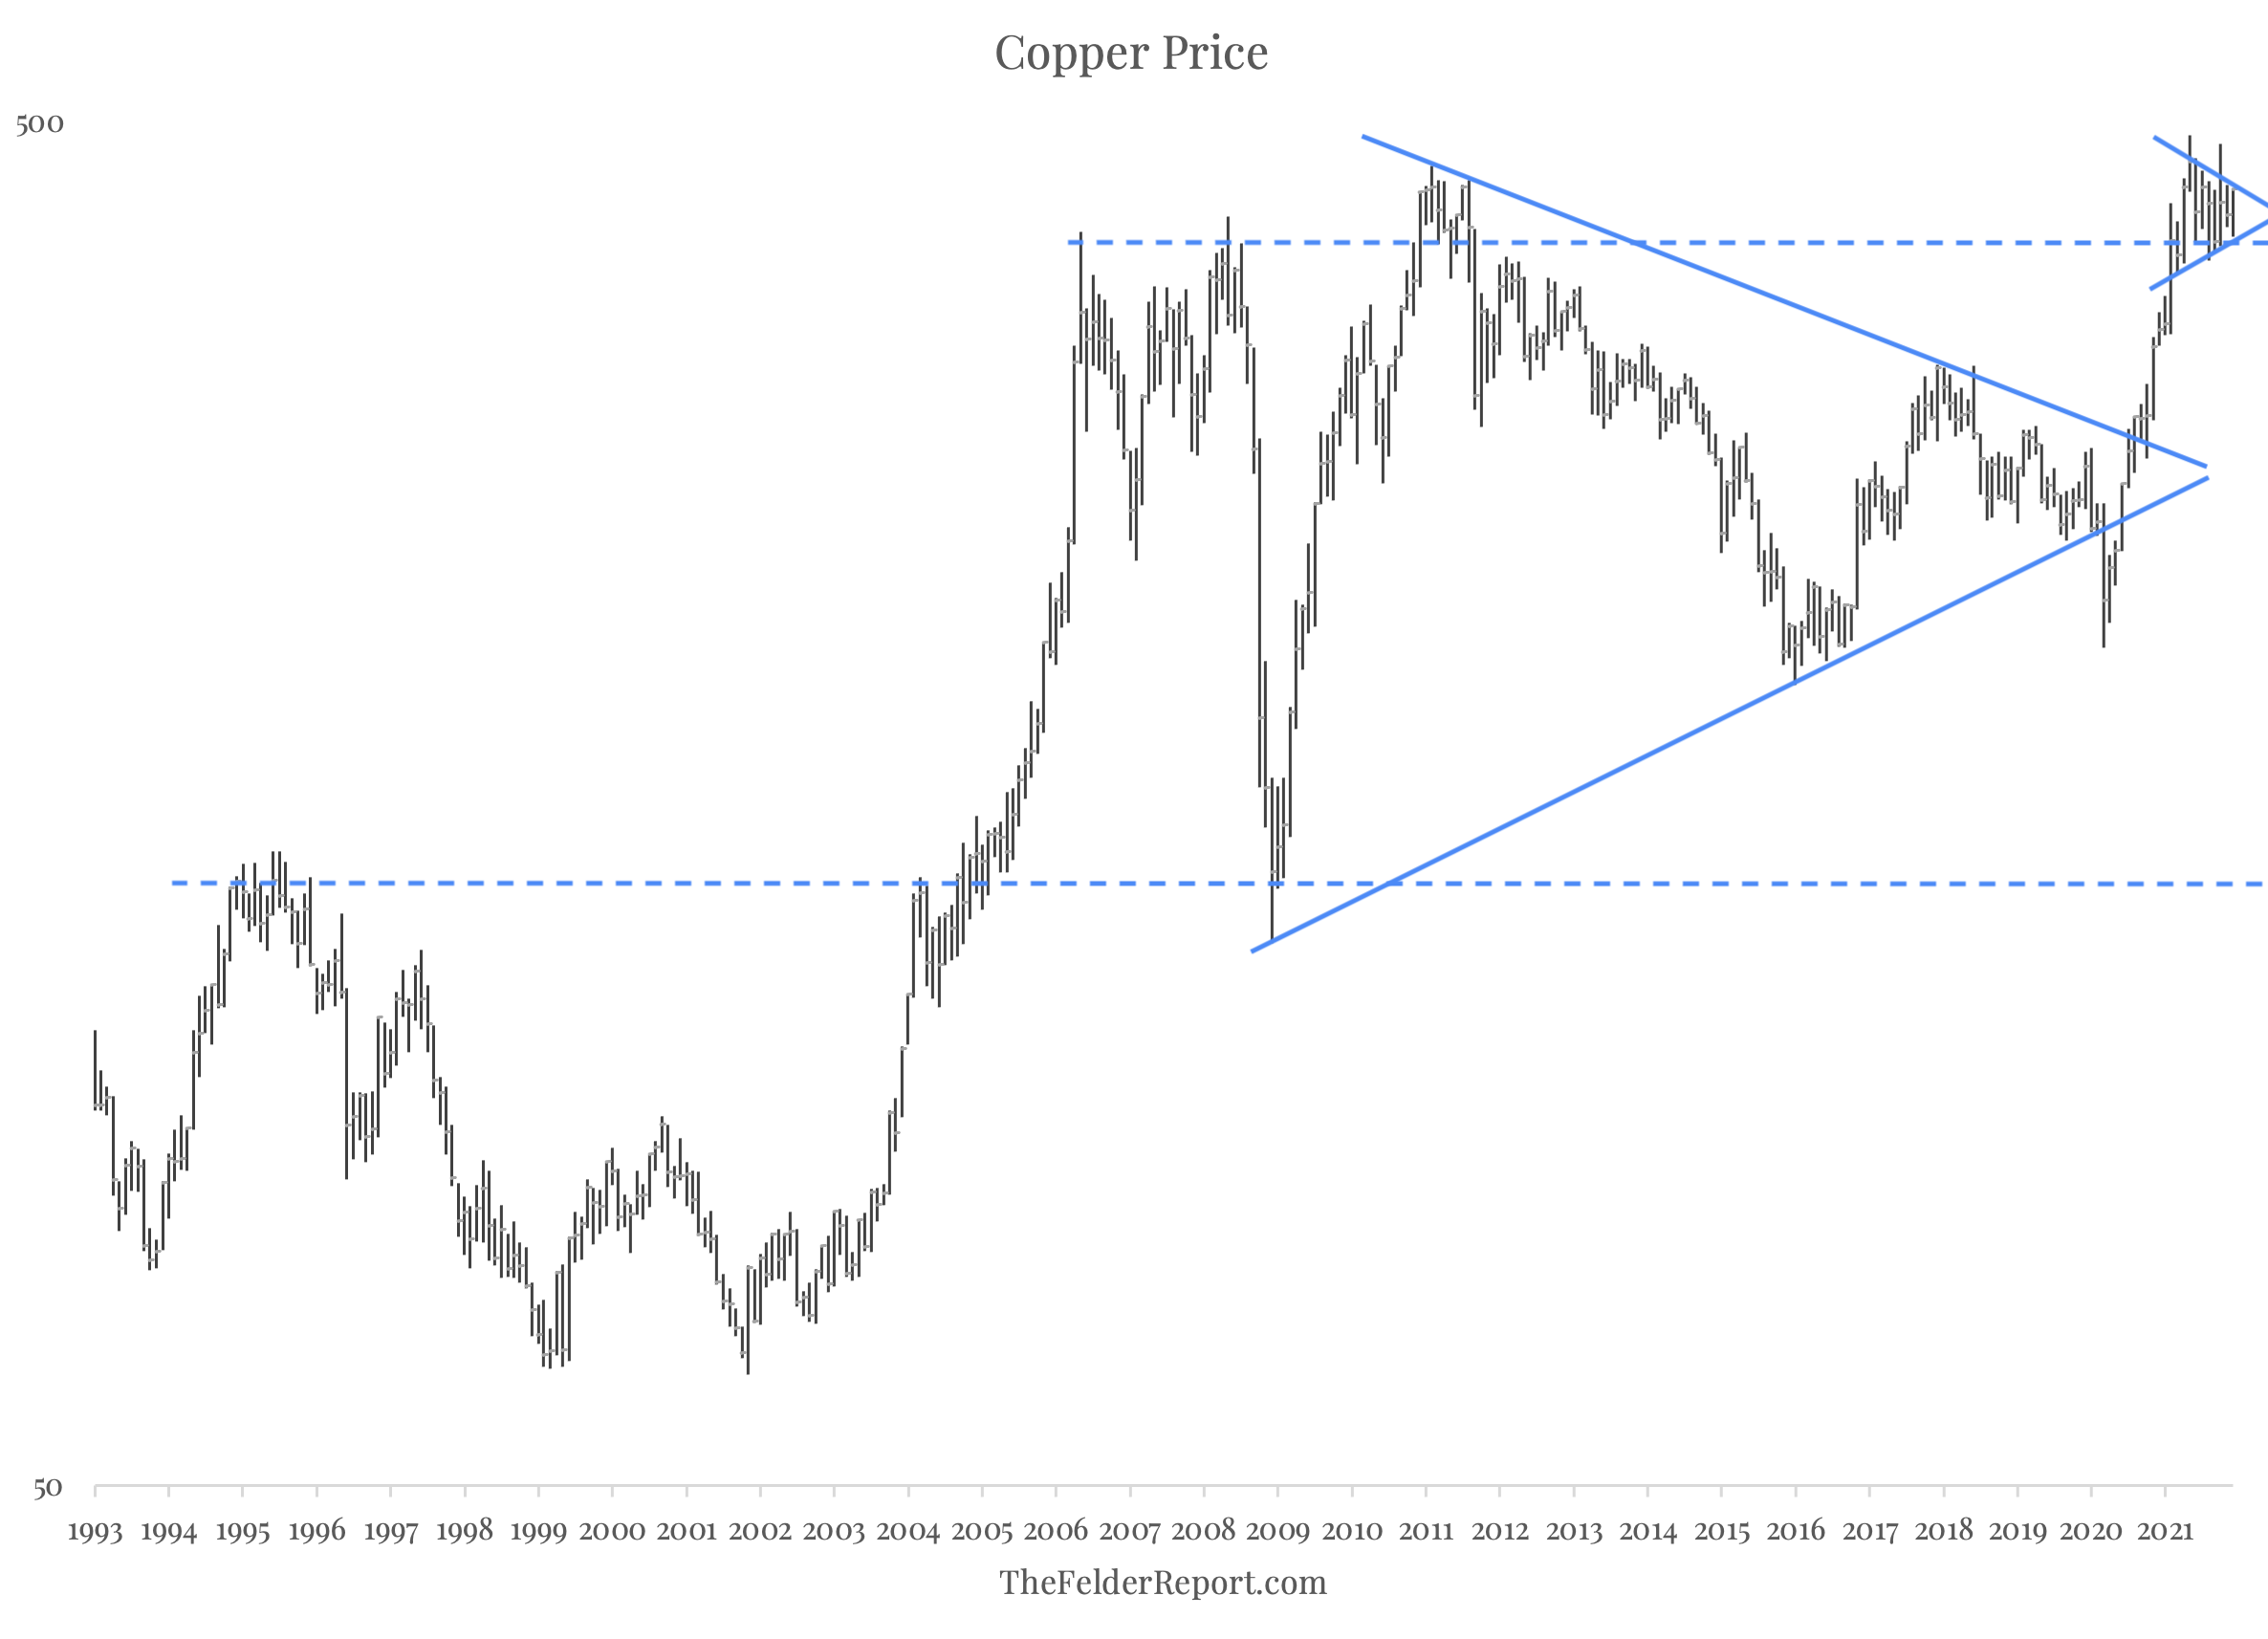
Almost a year ago, I published a post proclaiming, “Dr. Copper Delivers A Diagnosis Of Inflation,” in which I argued that copper’s breakout of its long-term consolidation range suggested inflation was poised to breakout, as well, contradicting the Fed’s “transitory” narrative. Last week’s CPI report showed headline inflation running its hottest reading in almost 40 years so I think it’s fair to say that our resident PhD economist proved prescient once again.
Over the past nine months or so, however, the copper price has entered another consolidation range. This one is similar to the symmetrical triangle it formed over the decade ending in 2020 only it is much shorter in time and much narrower in price. Still, it may be just as important to watch as that earlier one simply to see which way it eventually breaks.
A breakout lower could suggest that the surge in inflation we have seen over the past year will eventually wane and core CPI could fall back below 2% sometime over the next couple of years, as the copper price seems to lead inflation trends by about that much. Another breakout higher, though, would raise the prospect of inflation remaining elevated for an extended period of time.
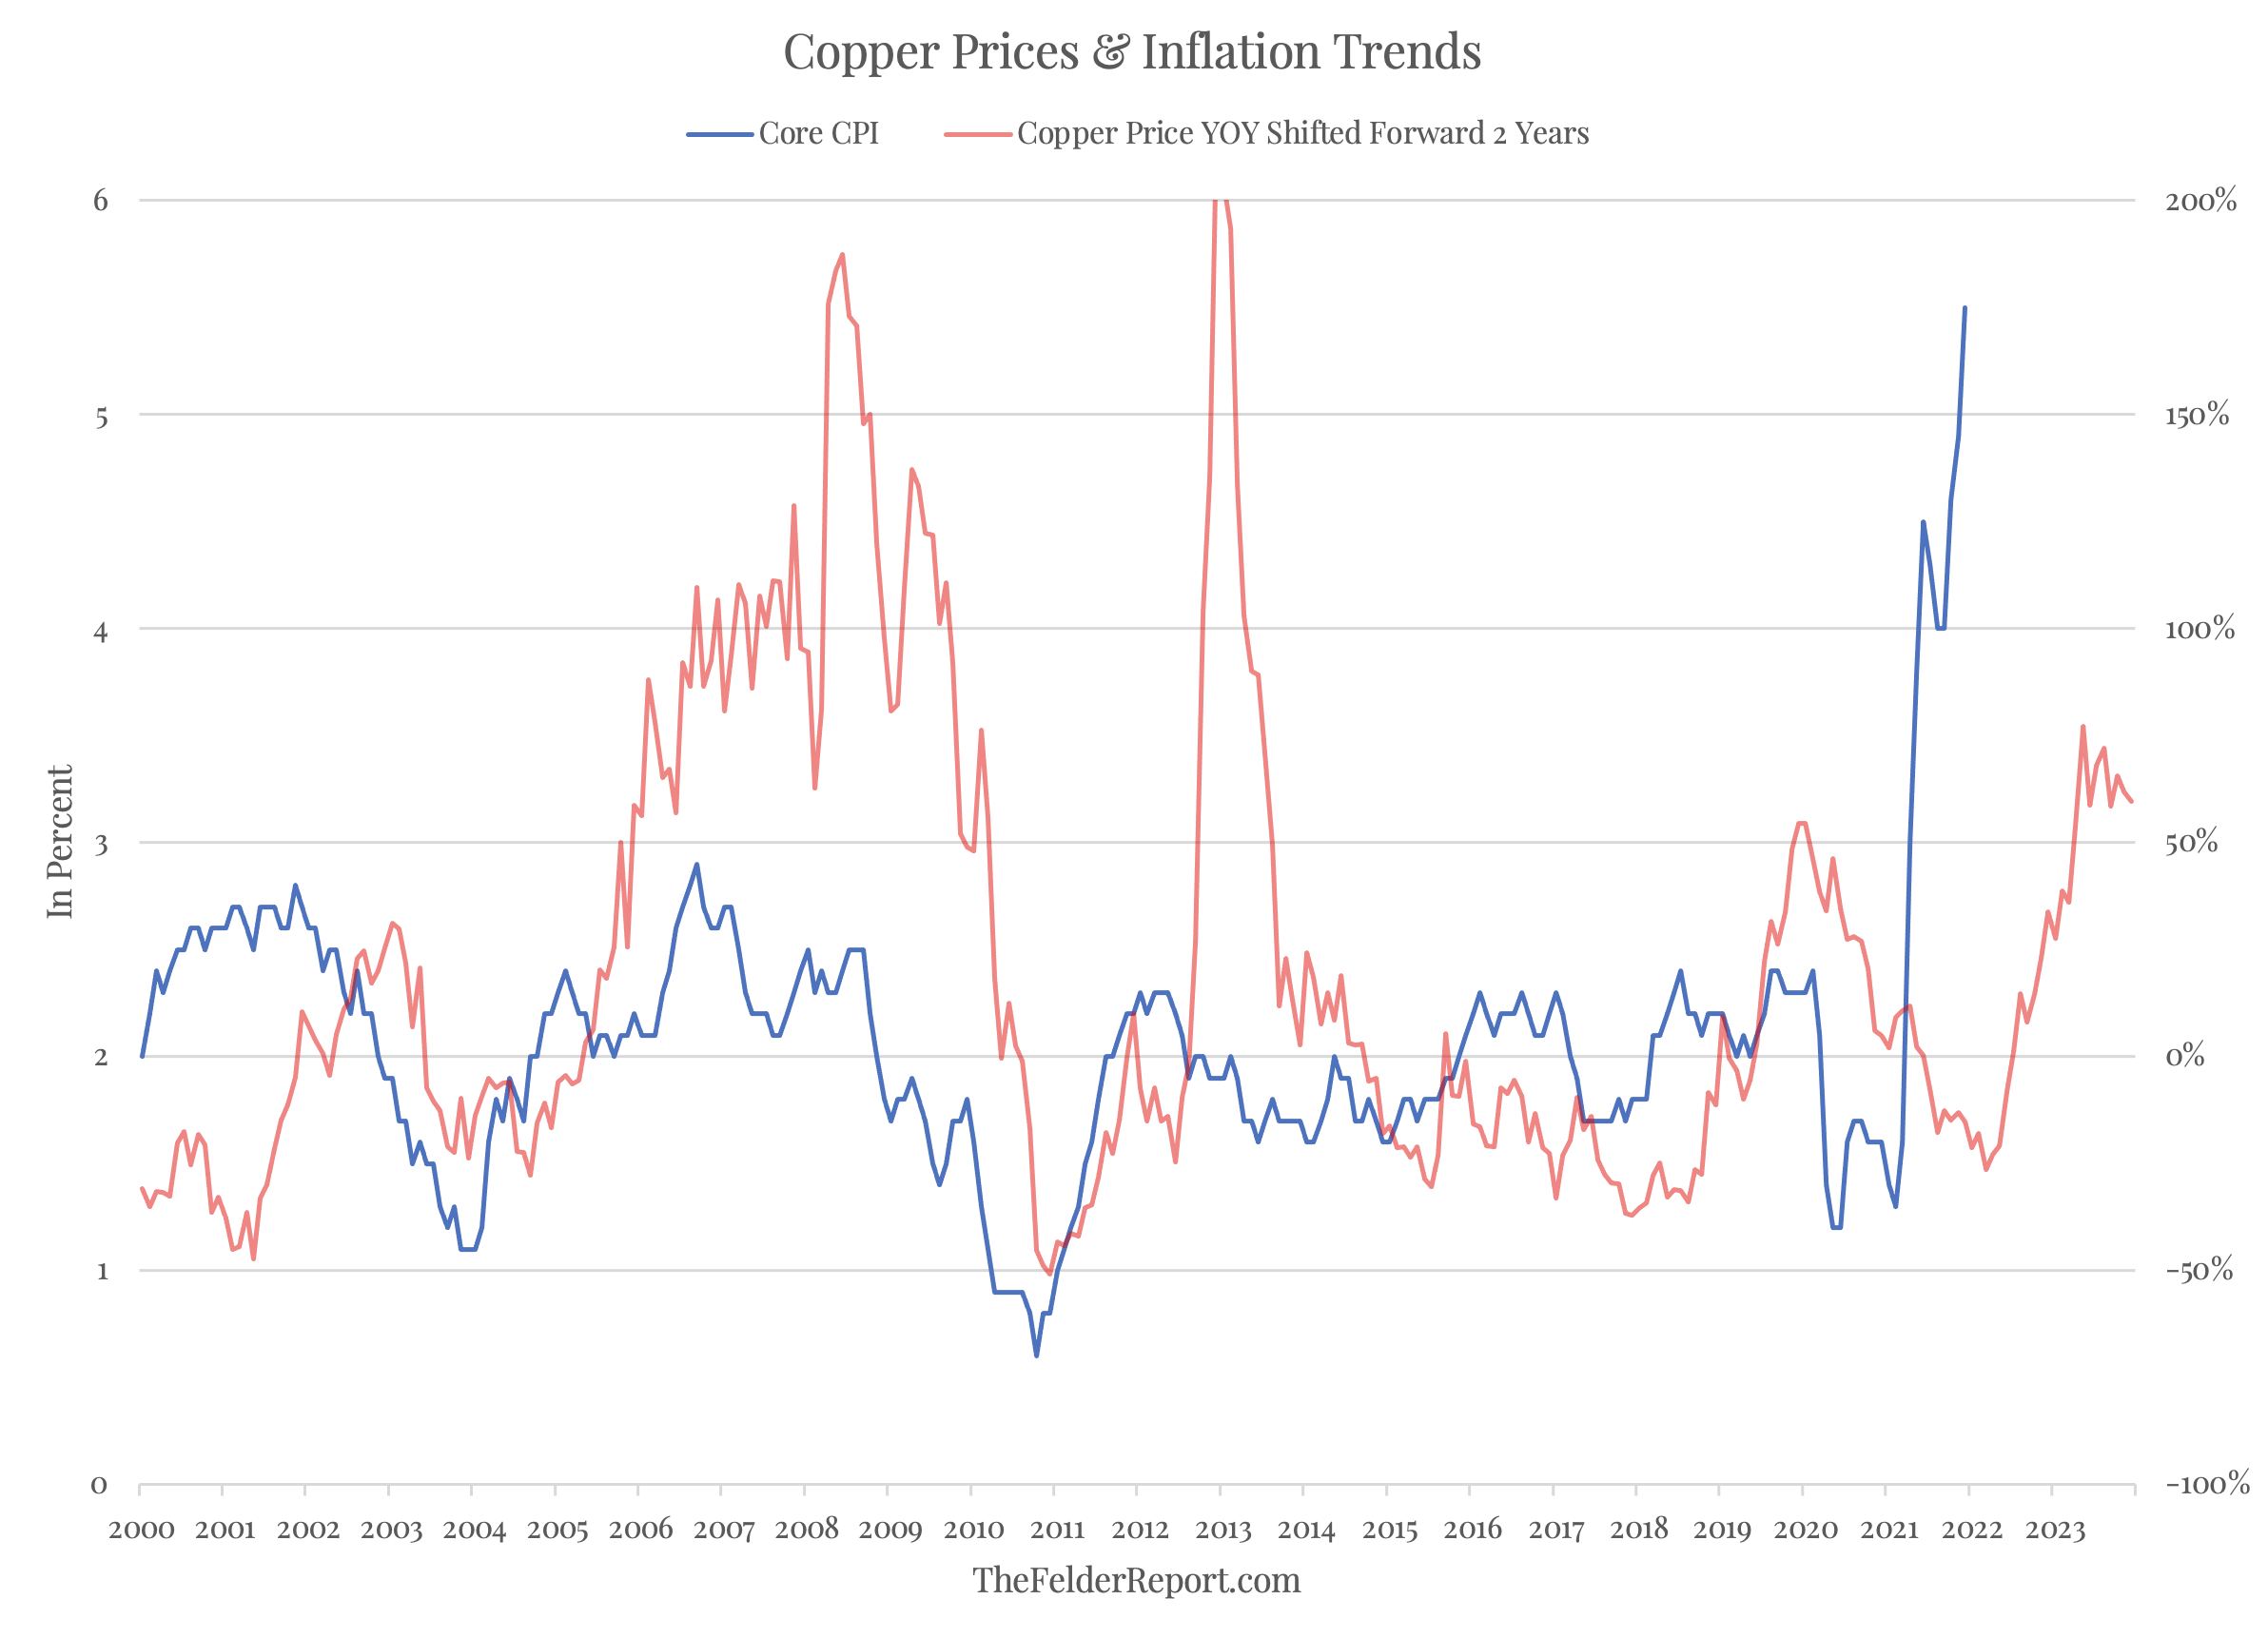
In this way, copper may prove to be a useful indicator as to the efficacy of the Fed’s nascent efforts at reining in inflation. If the central bank manages to do enough to bring inflation back under control, the copper price should reflect that outcome. But if the Fed fails to adequately address inflationary impulses within the economy, Dr. Copper will likely reveal that reality, as well, regardless of what the PhDs at the Eccles Building might profess.
