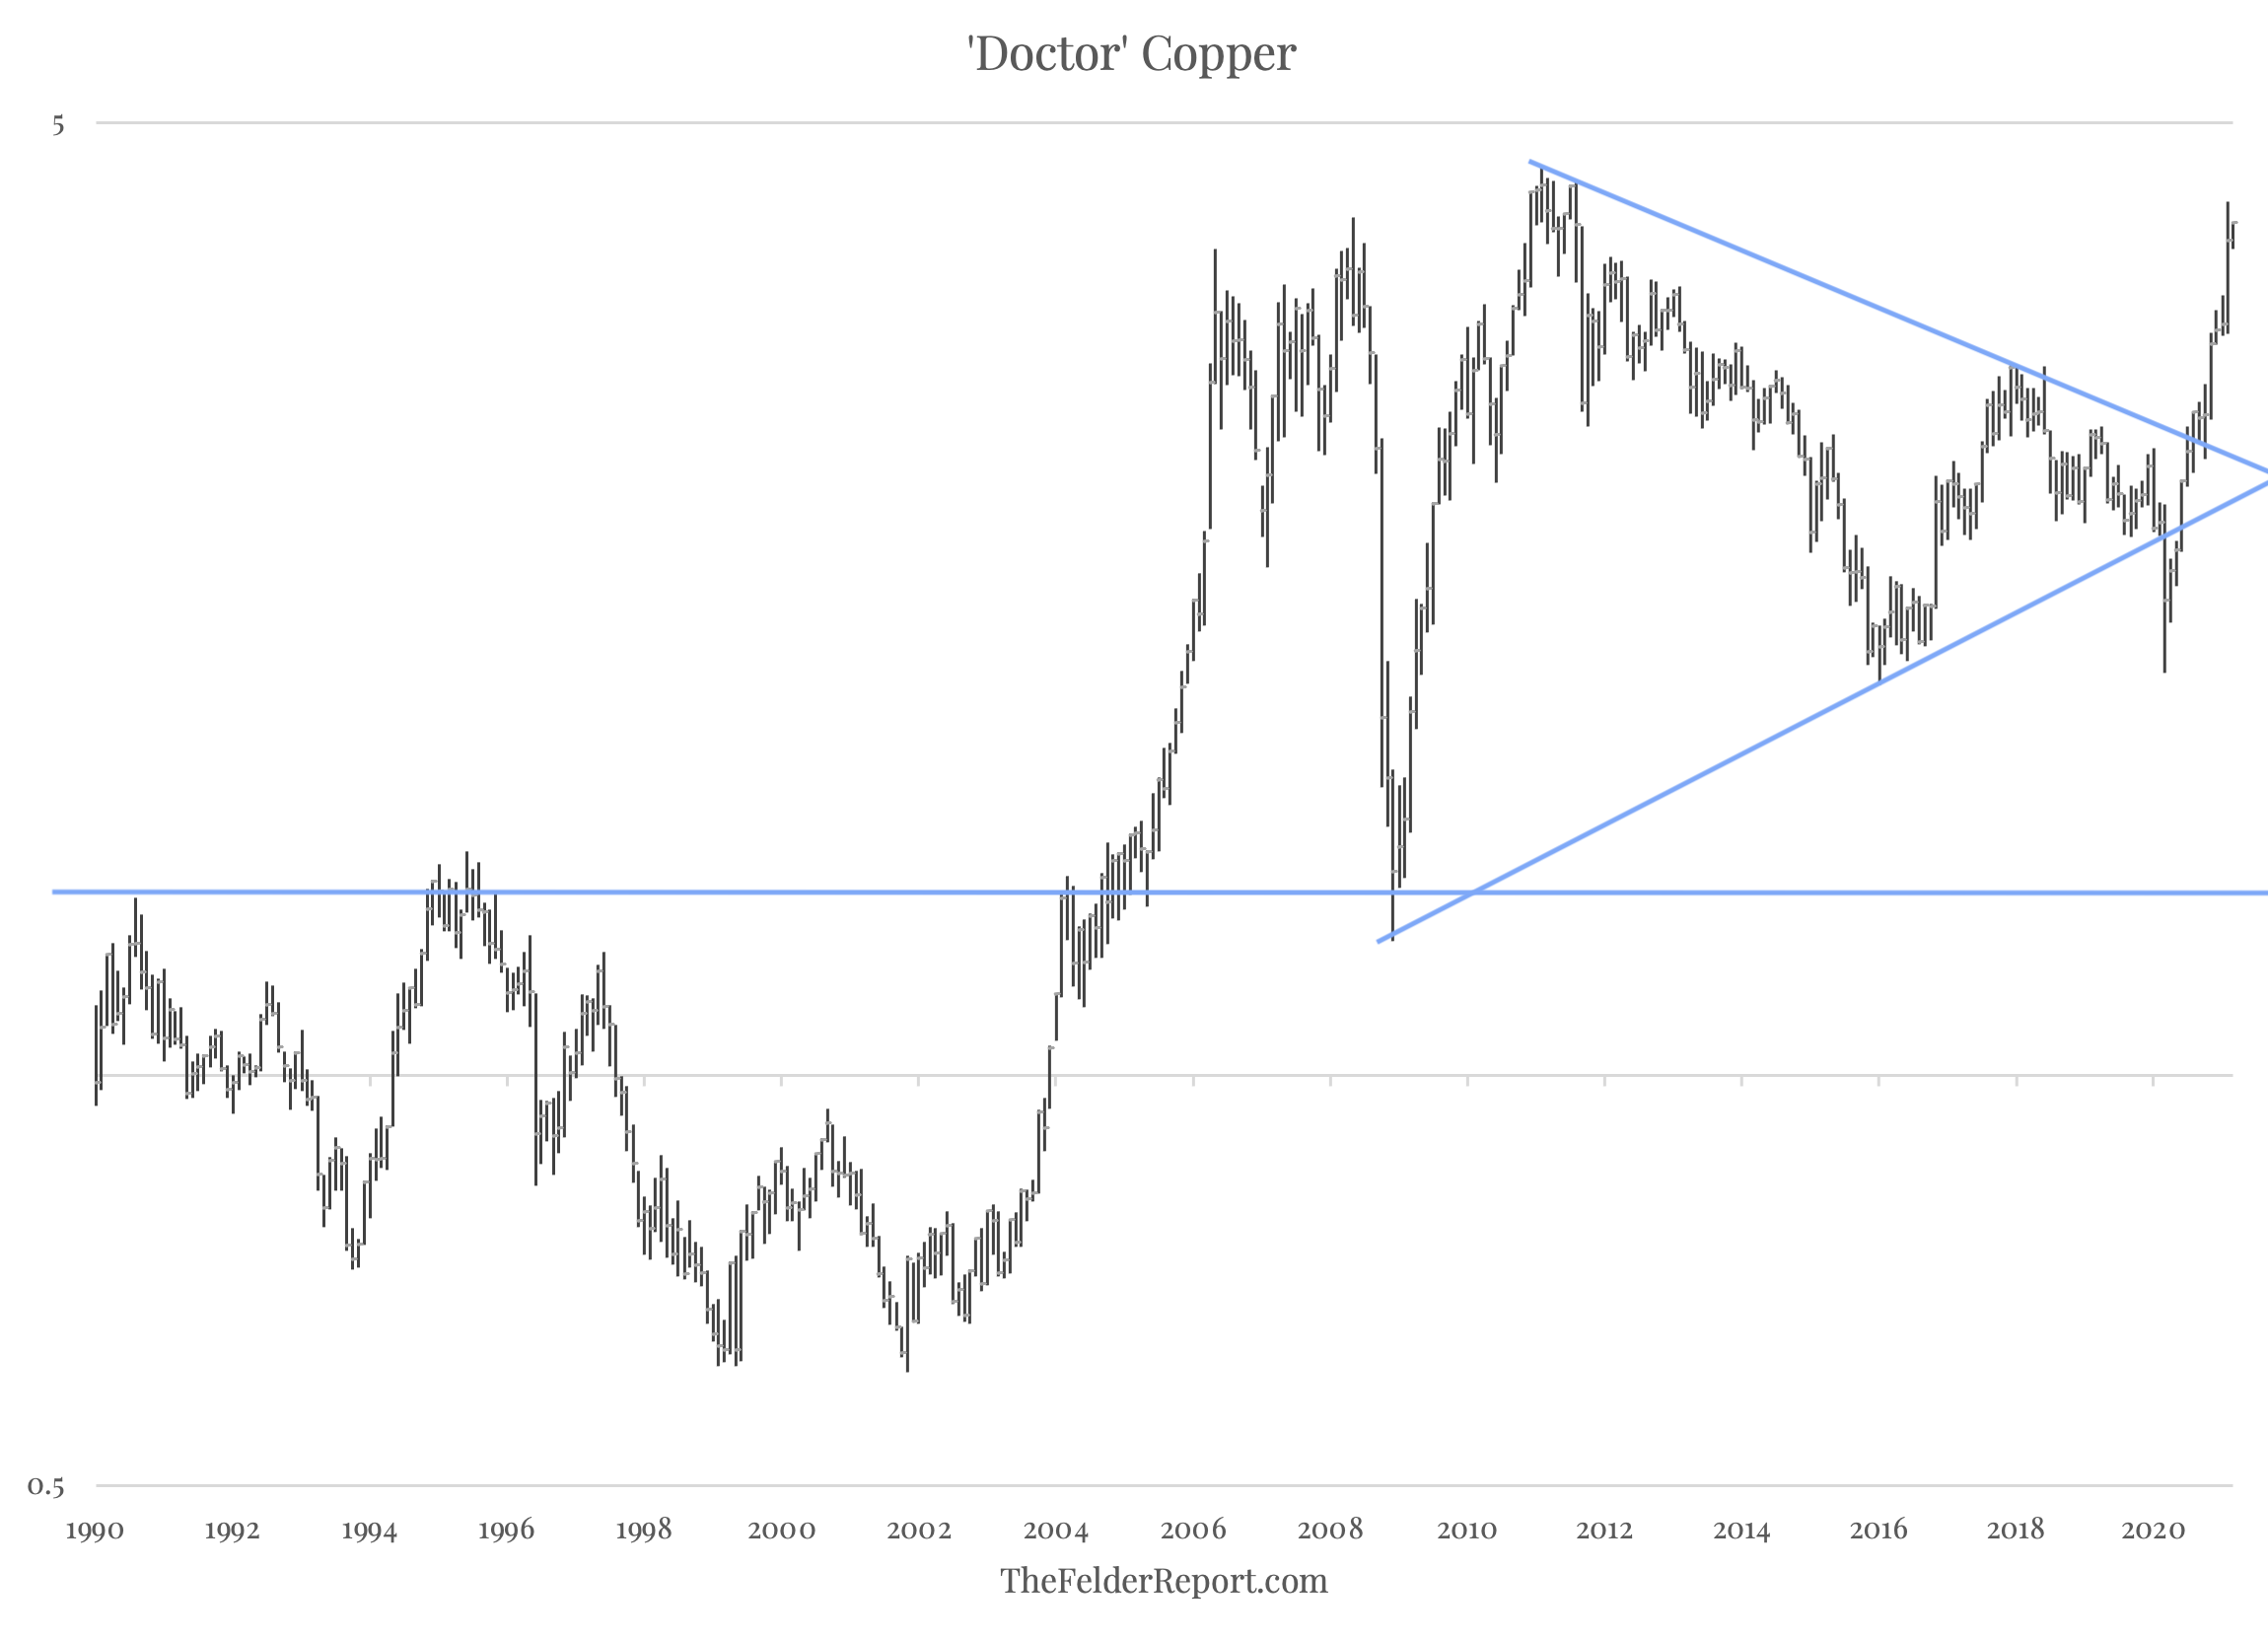
A little over a year ago, I shared a chart of the copper price writing, “A breakout above that [upper trend] line would suggest that inflation (even stagflation), after being written off as a relic of the past, could finally be making a comeback.” Well, the copper price broke down in an epic fakeout last year before reversing and breaking out, in convincing fashion, to the upside.
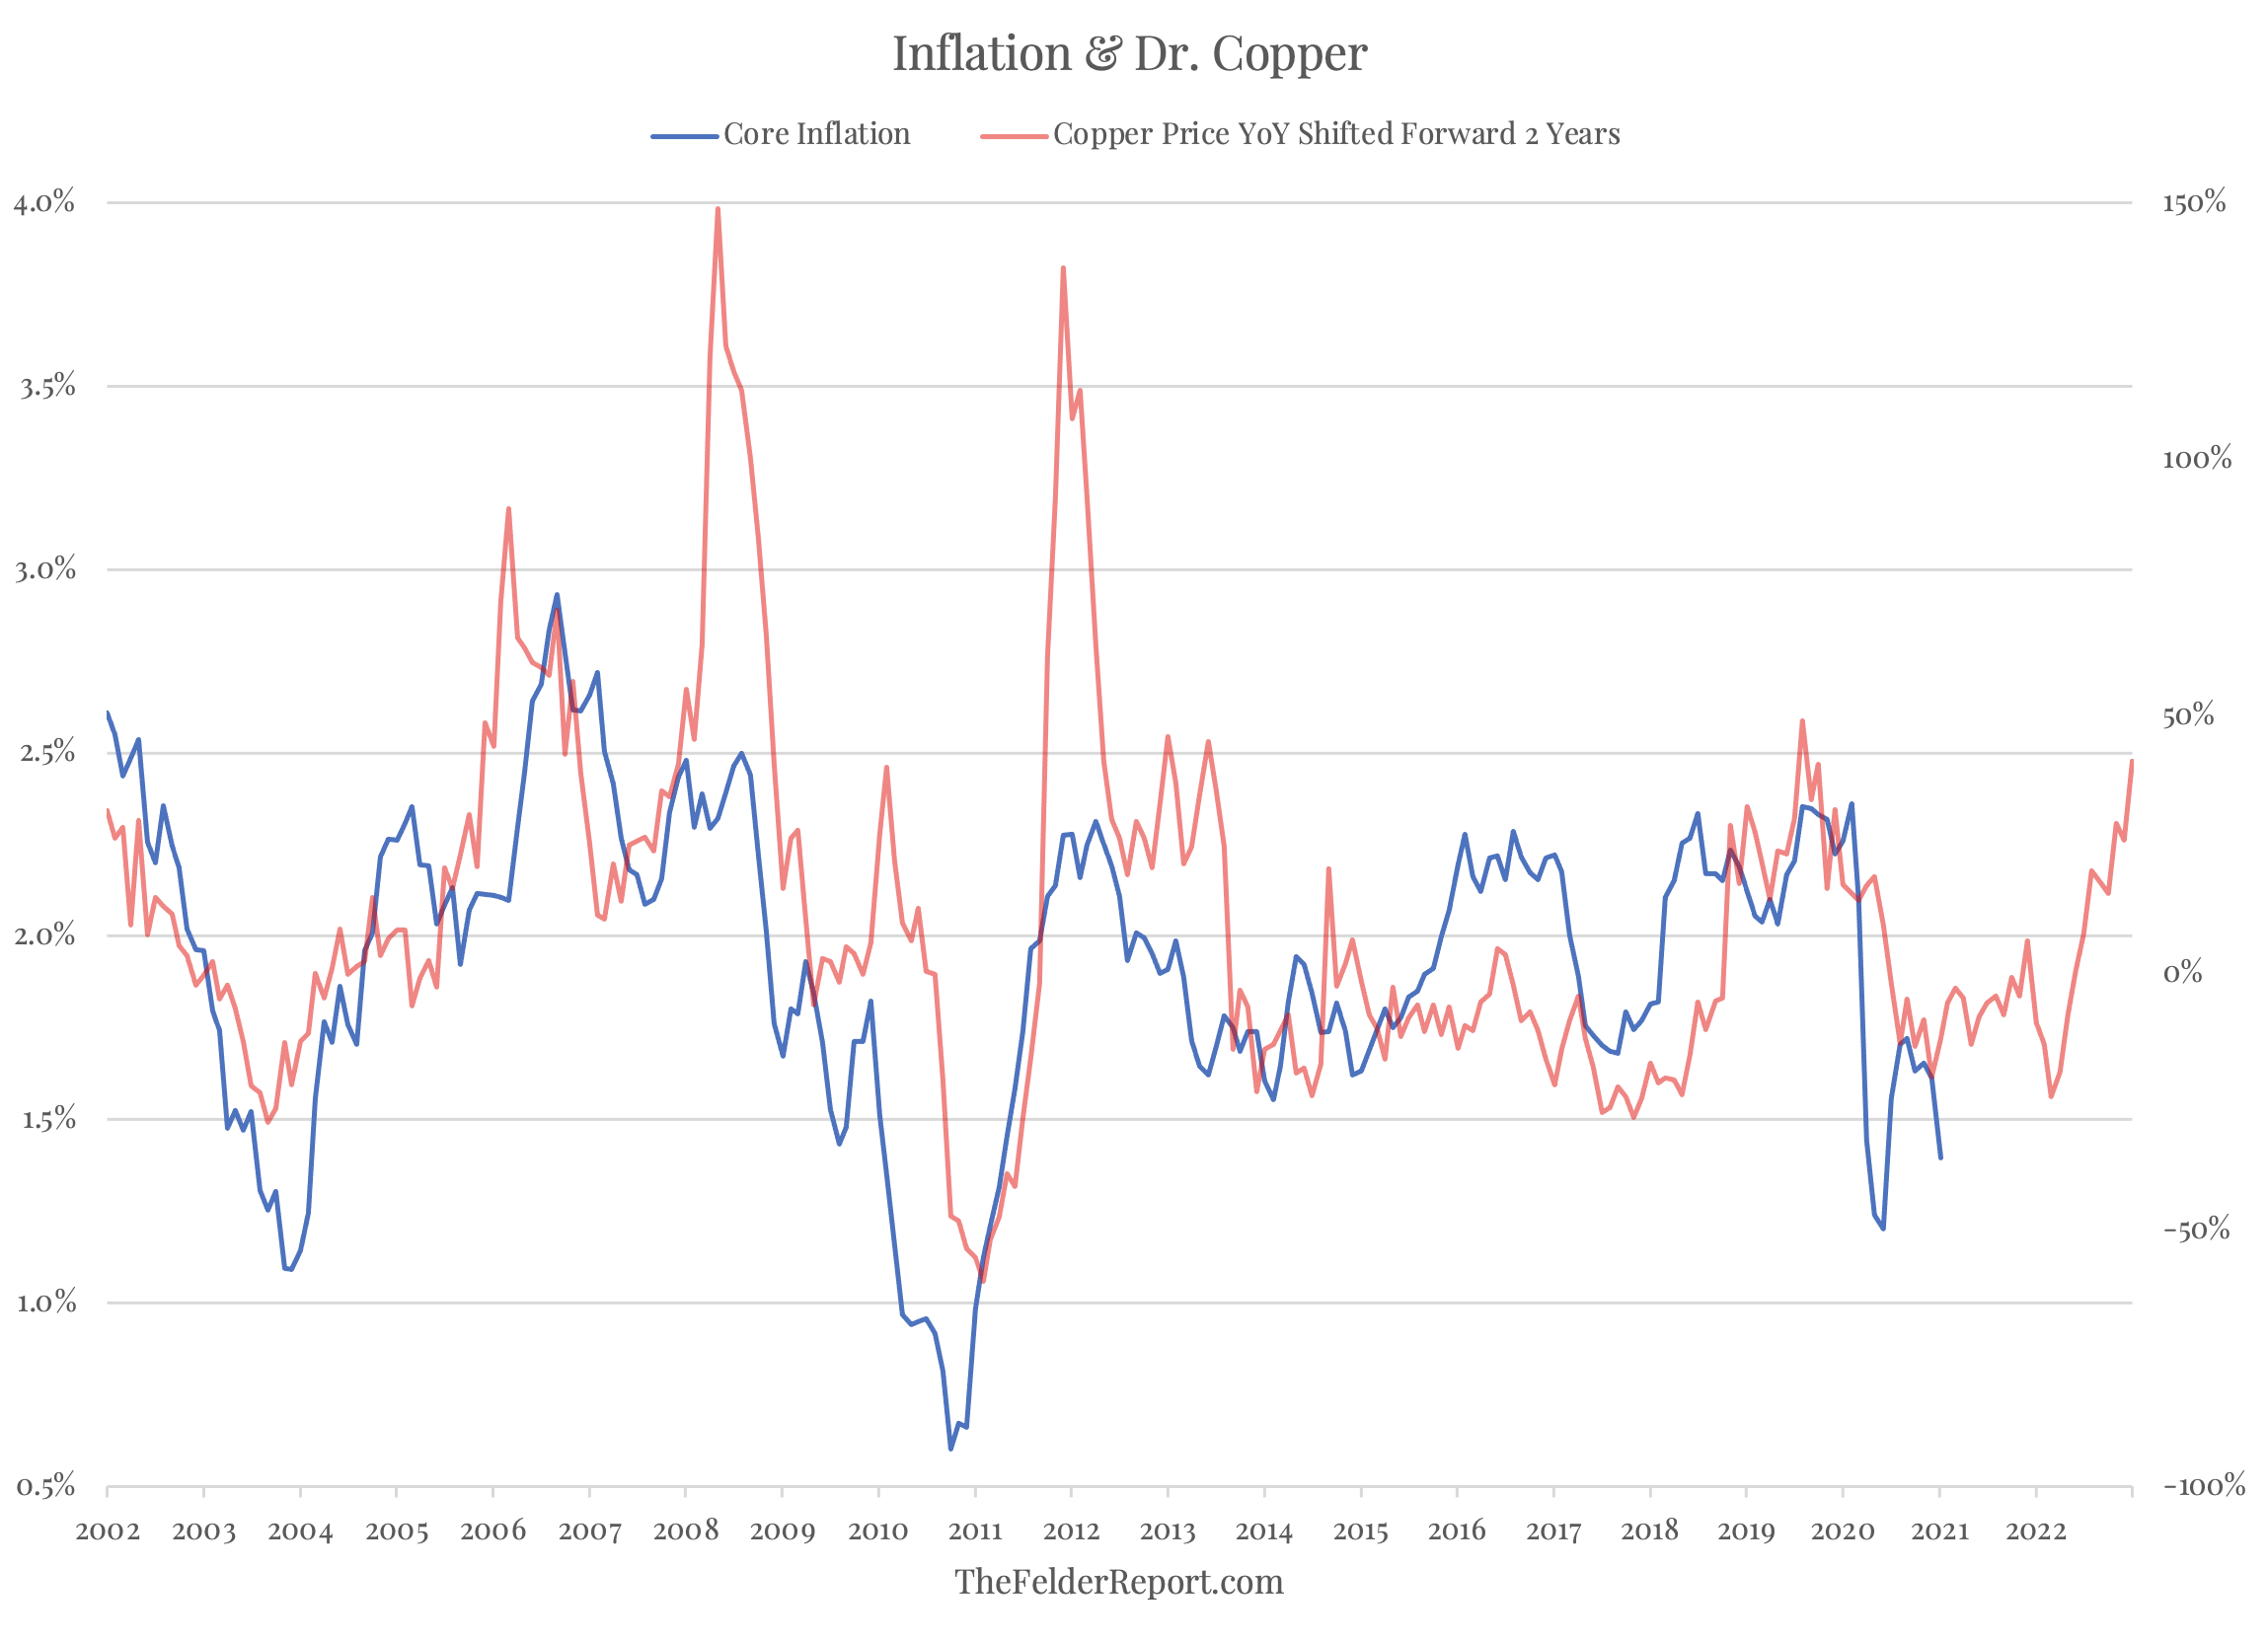
They call copper “doctor” because he’s supposedly got a PhD in economics. And when it comes to inflation, it’s certainly true that he is far more accurate with his forecasts than the vast majority of economists. The chart below plots the annual change in the copper price shifted forward two years along with core CPI. There’s a fairly tight relationship here which implies Dr. Copper is relatively adept at predicting inflation trends.
The recent breakout in the copper price suggests core inflation is likely too low at present and will soon begin to trend higher over the next couple of years. Because asset prices of all sorts have seemingly discounted a ‘lower for longer’ environment in both inflation and interest rates, this signal may be more meaningful than it might otherwise be.