
 Jim Stack has been assiduously studying markets in an effort to develop and hone a full-cycle investment discipline since he was first introduced to stock market risk back in the 1973-74 bear market. That experience instilled in him the modicum of skepticism needed to successfully navigate major market turning points, both tops and bottoms, as well as an infectious enthusiasm for investment research that still drives him today. It also set him on a journey that would eventually see him founding InvesTech Research, one of the most successful investment newsletters in the industry, and later Stack Financial Management, an SEC-registered advisory firm with billions under management. In this episode (recorded in Whitefish, Montana), Jim shares the key stories that shaped him as an investor and the lessons learned along the way. He also discusses how he developed some of the major indicators that drive his investment process and how they currently influence his approach to the market.
- Subscribe to Jim’s newsletter at InvesTech.com
- Get Norman Fosback’s Stock Market Logic
- Learn more about Whitefish, Montana explorewhitefish.com
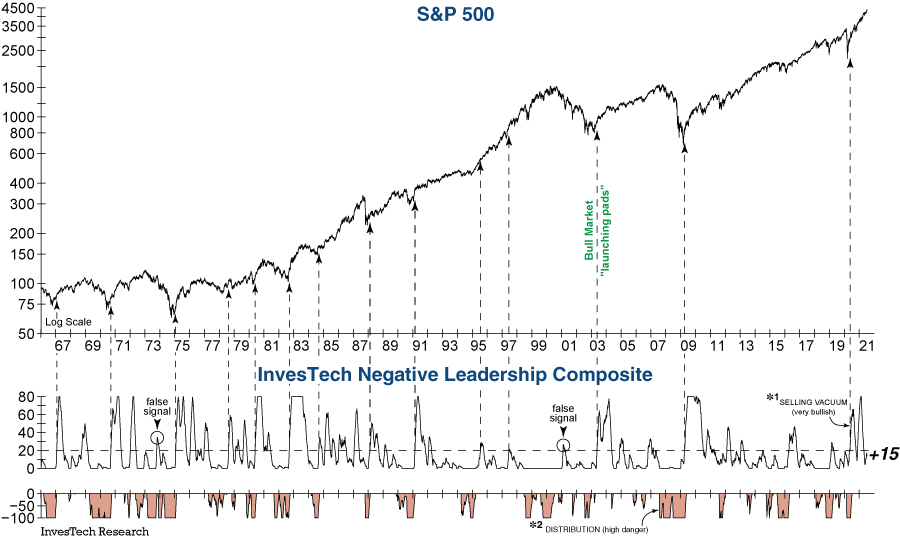
Below is InvesTech’s latest chart of its Negative Leadership Composite indicator along with their description of how to read it:
Measuring the real quality of internal leadership…
The Negative Leadership Composite (NLC) has served as one of InvesTech Research’s most reliable tools over our 40-year history for navigating bull and bear markets alike.
Selling Vacuum
The top half of our NLC, or what we call the bullish Selling Vacuum, rises as downside leadership evaporates. More often than not, the height and duration of this Selling Vacuum helps to indicate how strong a new bull market is – and how long it will last. For example, the instances when this index has climbed to very strong readings of +60 or +70, it confirmed the onset of a new multi-year bull market.
Distribution
Obviously, this Negative Leadership Composite doesn’t provide signals very often. When Distribution (shaded region) is present, it’s time to be more cautious and carry a higher cash reserve. But when a Selling Vacuum appears (especially after 6+ months of Distribution), it’s time to take notice and get ready to jump on a charge new bull market in stocks. The bottom (shaded) half of our NLC, also known as bearish Distribution, measures the rate of acceleration in downside leadership. This is the most vulnerable, dangerous region for the stock market… it is when bear markets can strike.