
If I had to choose one fund that was the poster child for the current mania in the stock market it would have to be the Ark Innovation ETF (ARKK). As Bloomberg’s Eric Balchunas recently pointed out, the surging interest in the fund’s shares is something to behold. The firm’s funds and strategies have become so popular, in fact, that JP Morgan was induced to put together a structured product that leverages the performance of three of the firm’s most popular ETFs.
Wow, $ARKK volume likely to hit $1b today, that's top 1% among ETFs, an insane number for a stock picking active strategy ETF. For context, that's more volume than Johnson & Johnson, Home Depot etc. This ETF (now $15b in aum up from <$2b on Jan 1) never ceases to amaze.. pic.twitter.com/kTuMY7Dxu3
— Eric Balchunas (@EricBalchunas) December 9, 2020
This panic buying is due, in no small part, to its scorching hot performance over the past nine months driven by Tesla, the fund’s largest holding, as well as other similar speculative favorites. Since the March low, the ETF has nearly tripled in price.
Today, the ETF’s top 20 holdings trade at a median price-to-sales ratio of 22. Aggregating the market capitalizations and revenues of all them yields a price-to-sales ratio of 18. The aggregate enterprise value-to-EBITDA of the group is over 1,800 so its pretty clear that “innovation” in this sense is synonymous with “speculation” as the majority of the fund’s holdings are money losing enterprises.
| Symbol | Name | Price-to-Sales Ratio |
| CRSP | CRISPR Therapeutics AG | 139.3 |
| EDIT | Editas Medicine Inc | 41.8 |
| IOVA | Iovance Biotherapeutics Inc | |
| MCRB | Seres Therapeutics Inc | 97.3 |
| MTLS | Materialise NV | 11.4 |
| NTLA | Intellia Therapeutics Inc | 54.3 |
| NVTA | Invitae Corp | 39.1 |
| PD | PagerDuty Inc | 18.2 |
| PRLB | Proto Labs Inc | 9.3 |
| PSTG | Pure Storage Inc | 3.5 |
| ROKU | Roku Inc | 26.7 |
| SPOT | Spotify Technology SA | 7.2 |
| SQ | Square Inc | 12.7 |
| TDOC | Teladoc Health Inc | 32.6 |
| TREE | LendingTree Inc | 3.7 |
| TSLA | Tesla Inc | 21.5 |
| TWLO | Twilio Inc | 36.4 |
| TWOU | 2U Inc | 3.7 |
| WORK | Slack Technologies Inc | 29.2 |
| Z | Zillow Group Inc | 9.0 |
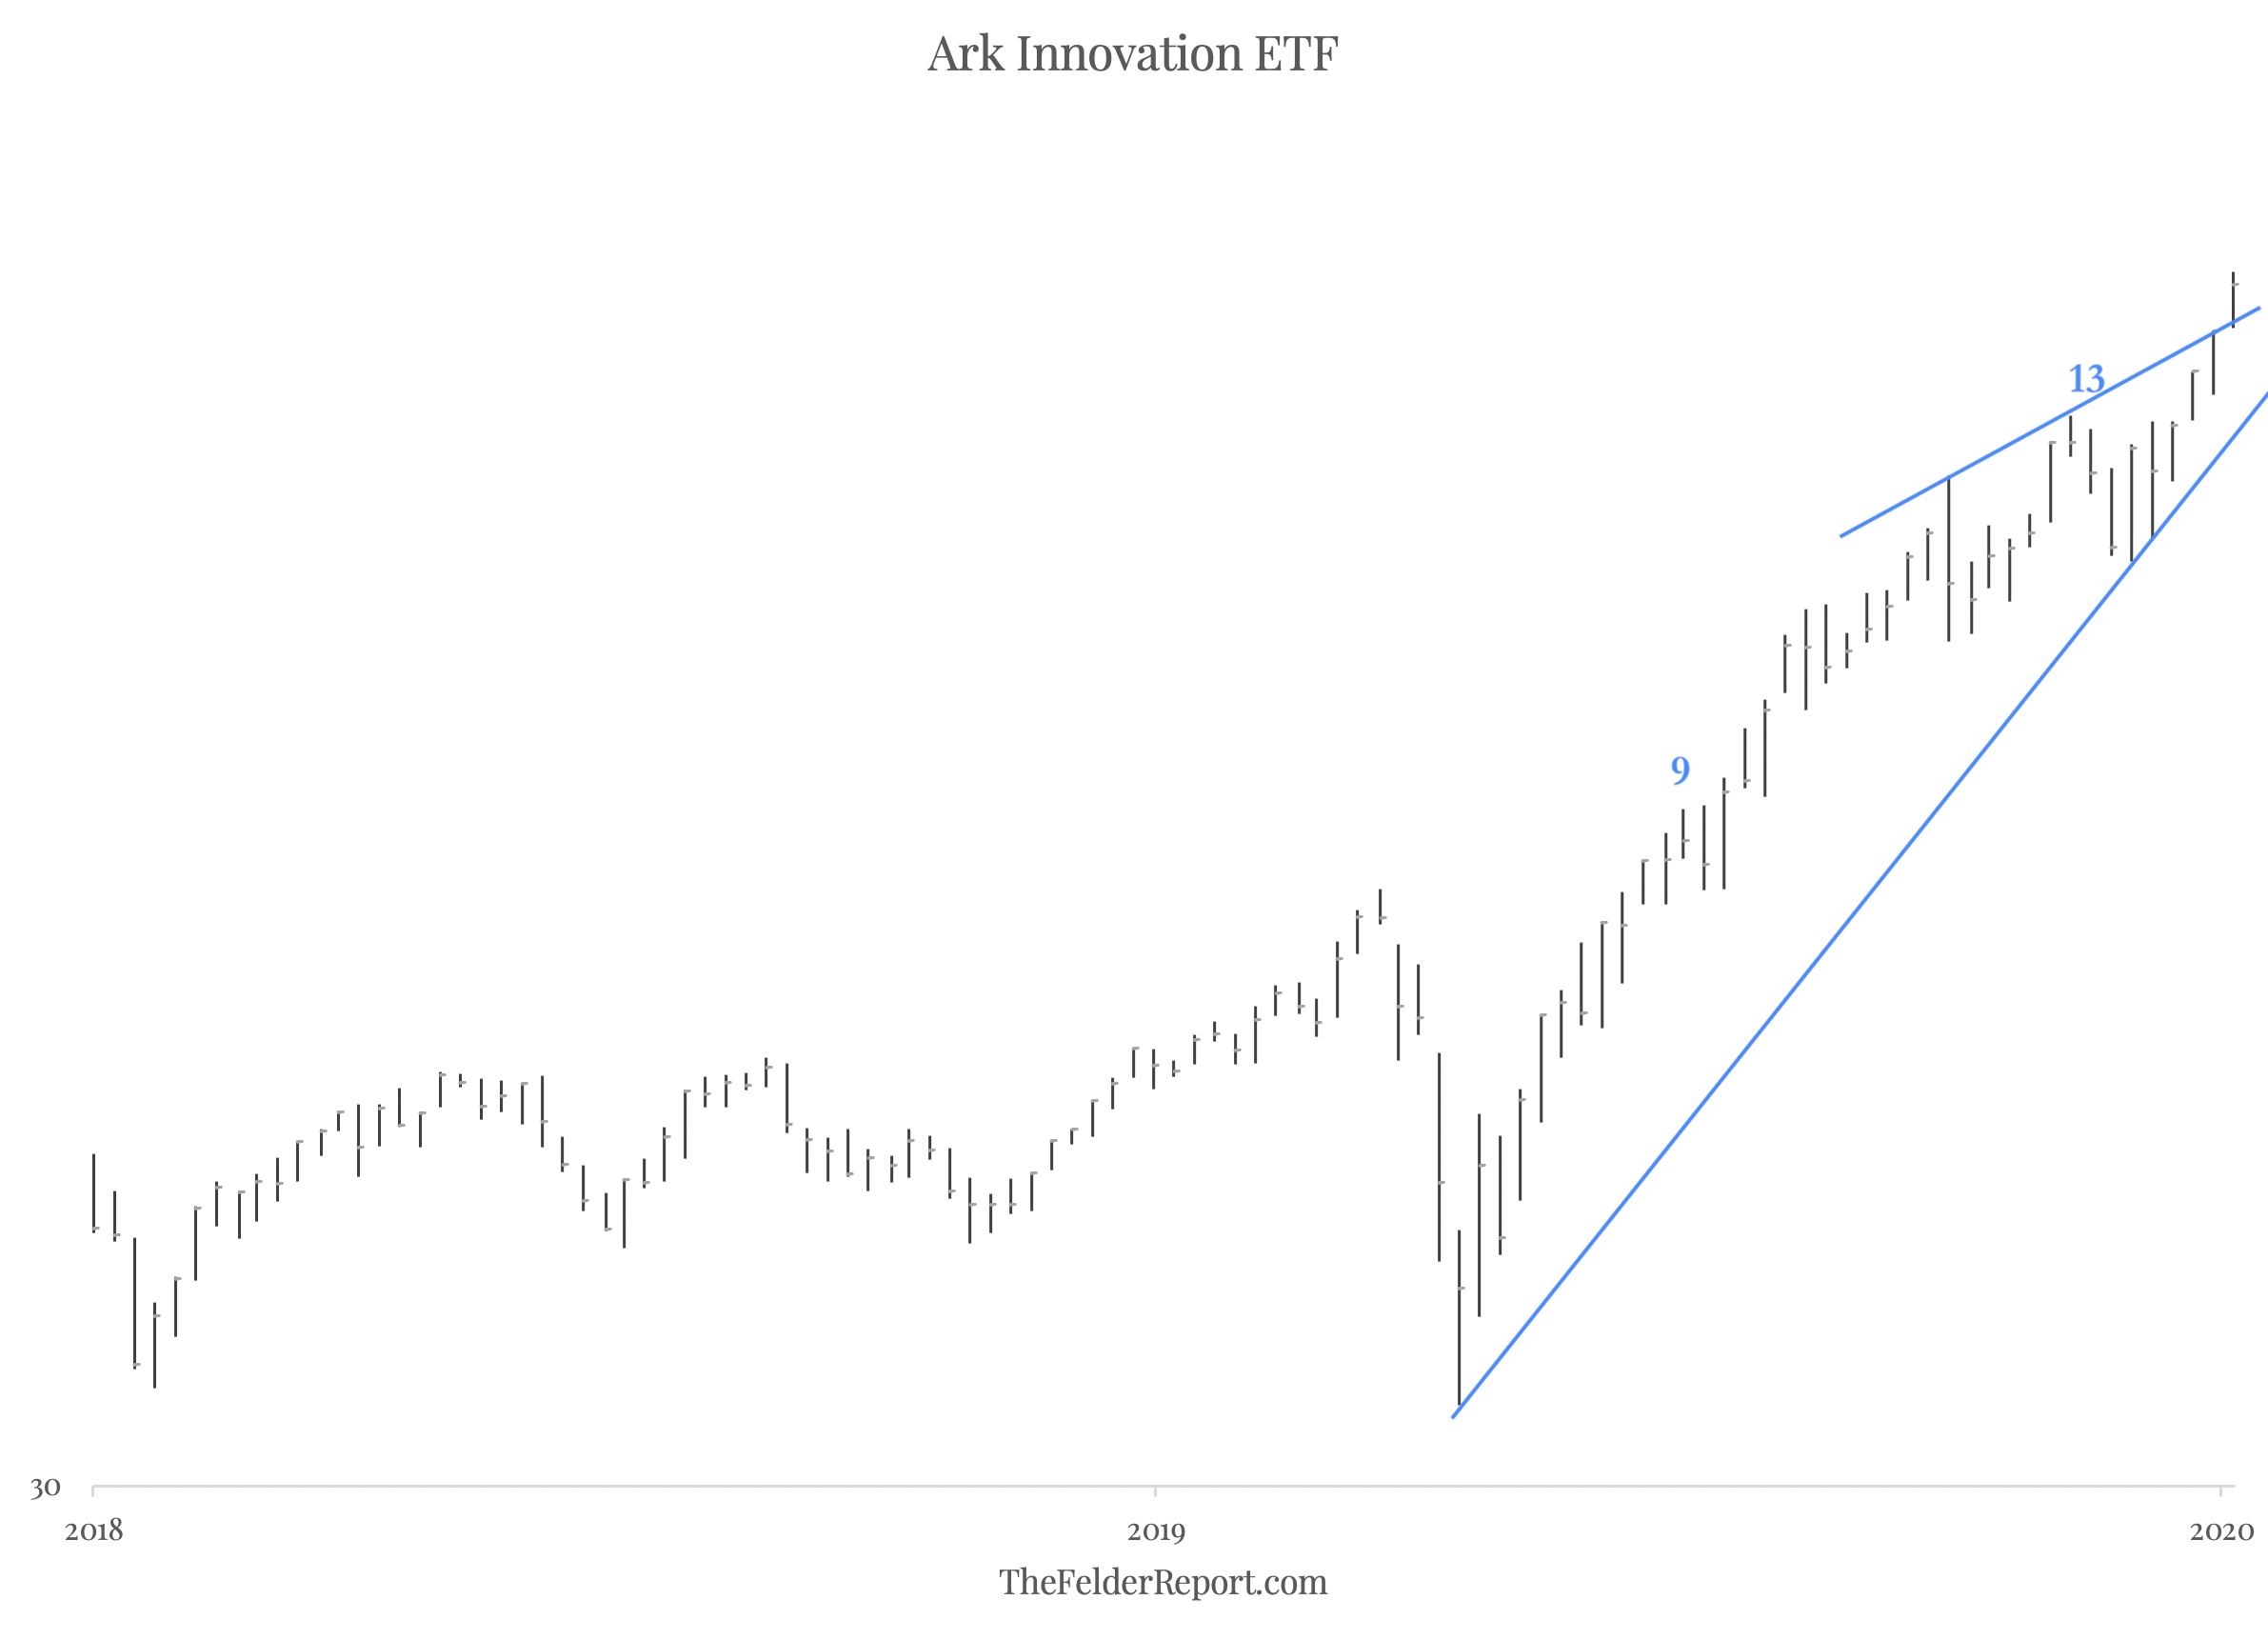
Technically, the ETF completed a monthly 9-13-9 DeMark Sequential sell signal on December 1. This would suggest that the multi-year uptrend may soon be exhausted.

Zooming in a bit to look at the weekly chart, we can see that prices formed a bearish wedge pattern over the past several months. However, the ETF didn’t respond to the recent DeMark Sequential 13 sell signal and created a “throw-over” above the upper trend line. Interestingly, momentum, though, has formed a topping pattern of its own in the process.
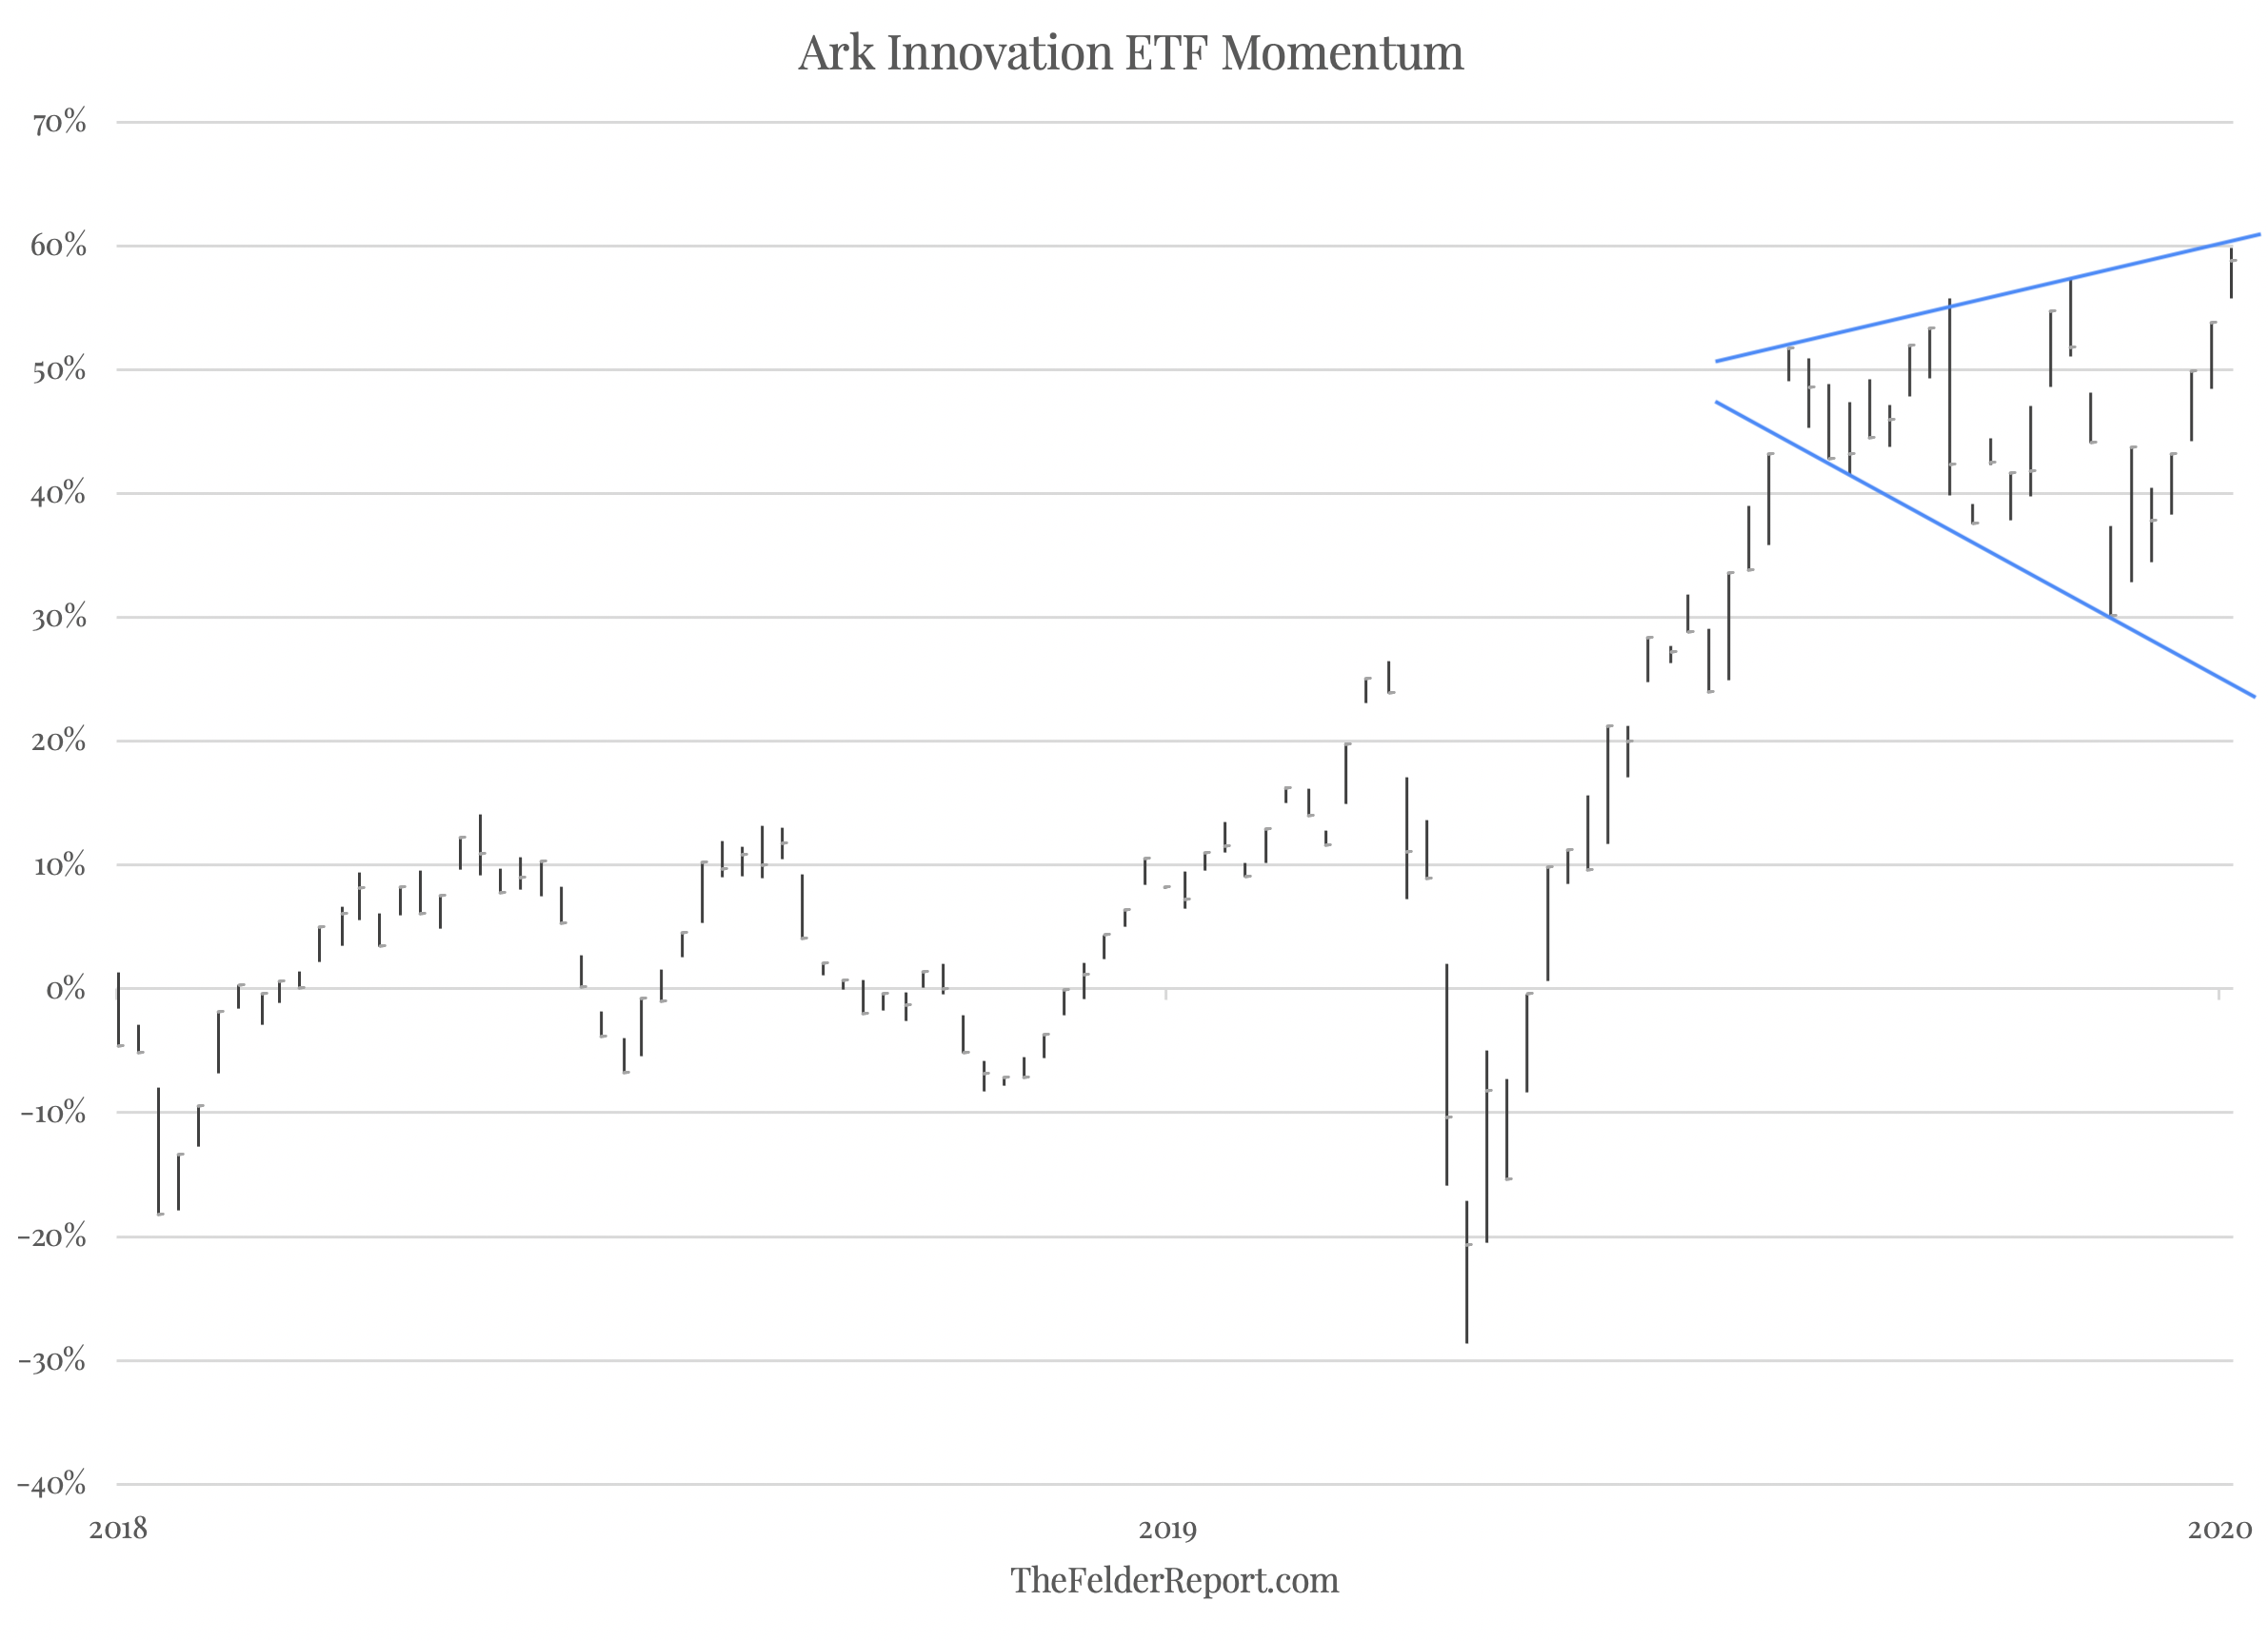
According to Edwards and Magee, “The Broadening Formation may be said to suggest a market lacking intelligent sponsorship that is out of control—a situation, usually, in which the ‘public’ is excitedly committed and is being whipped around by wild rumors.” Technical analysis of this sort was not intended to be applied to momentum but I think it does a uniquely good job of describing what we are watching in this ETF right now.
They continue, “the very fact that chart pictures of this type make their appearance, as a rule, only at the end or in the final phases of a long Bull Market lends credence to our characterization of them.” Certainly, it feels, from a sentiment perspective, that things are about as frothy as they get. Technicals would appear to be confirming that message. And because of the extreme overvaluation of the ETF’s components, I would not be surprised at all to see a fund like this lose 90% of its value through the back half of the current cycle.