The majority of the research I do is company specific. But over the past few years I’ve been much more concerned with the macro risks to my micro strategy. Extreme valuations, matched by euphoric sentiment and technical warning signs, have had me focusing on the big picture more than I normally would like to. Balancing the two has really been a high wire act.
In studying individual companies the research is pretty straight forward. I want to find stocks that offer a very compelling risk/reward setups (like Apple in early-2013 and Herbalife in early-2015). To do this I use a blend of fundamental and technical signals I’ve found to be very effective over the years.
The macro research I do, though, can be much more creative and experimental. I try to keep an open mind about things in the markets generally but macro is one area where it’s critical. There are just so many narratives at work at the same time and they typically overpower the fundamentals for long stretches of time.
Understanding what is driving markets and how those narratives may be changing may seem like a fool’s errand but it’s integral to a successful macro approach. One narrative that has been driving markets recently is the fear of a 1987 crash redux. Some may claim this fear itself is a contrary indicator that prevents a crash from actually occurring. When too many are fearful of something in the markets it rarely comes to pass.
However, as recently noted by Robert Shiller in the New York Times, these sorts of fears can actually become a self-fulfilling prophecy and this is precisely what happened in 1987:
It appears that a powerful narrative of impending market decline was already embedded in many minds. Stock prices had dropped in the preceding week. And on the morning of Oct. 19, a graphic in The Wall Street Journal explicitly compared prices from 1922 through 1929 with those from 1980 through 1987. The declines that had already occurred in October 1987 looked a lot like those that had occurred just before the October 1929 stock market crash. That graphic in the leading financial paper, along with an article that accompanied it, raised the thought that today, yes, this very day could be the beginning of the end for the stock market. It was one factor that contributed to a shift in mass psychology. As I’ve said in a previous column, markets move when other investors believe they know what other investors are thinking.
In fact, Paul Tudor Jones famously used the price analog of the 1929 stock market peak and crash to profit mightily from the crash in October of 1987. So it may pay to keep a close eye on how these 1987 fears in the marketplace today evolve over the next several weeks or months. Because if the stock market turns down again and the 1987 rhetoric heats up it could get very interesting.
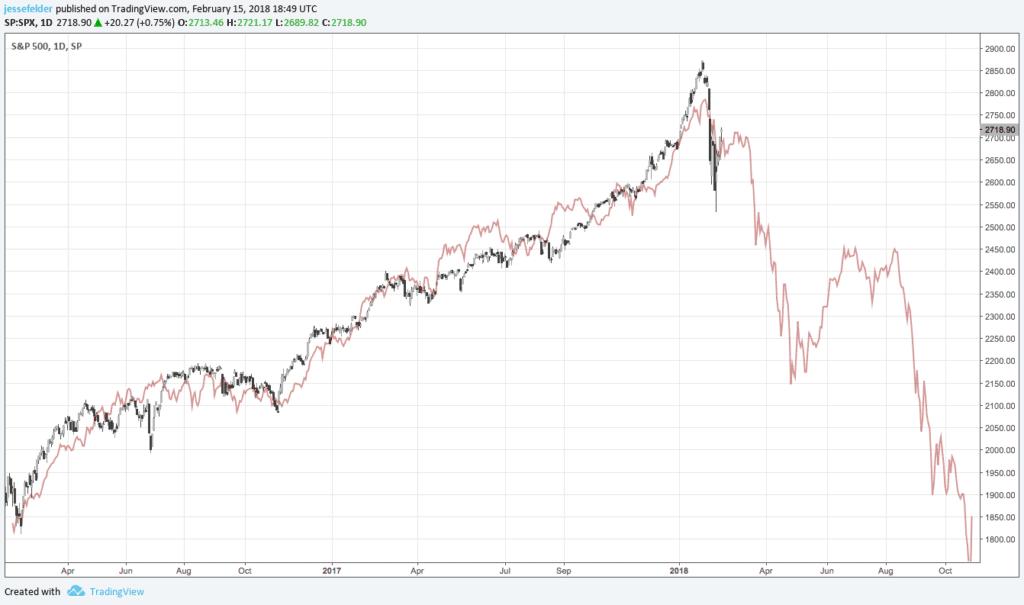
Still, when I look at price analogs to the current environment there’s another one that is a bit more compelling than 1987 and that is the two years leading up to the epic 1990 Nikkei peak. According to Nautilus Research’s analog engine there is a 98% correlation between it and the past two years in the S&P 500. The chart below plots the S&P 500 (in black) against the Japanese Nikkei (in red) over that span.
To be sure, price analogs are not the be-all, end-all when it comes to macro analysis, not by any stretch of the imagination. They are just a very small piece of a much larger puzzle. And, certainly, this one could turn out to be nothing more than an interesting exercise in price patterns and investors psychology.
That said, should stock prices today rhyme with that earlier manic blowoff top then investors, who have been aggressively exposing themselves to risk assets in recent years, may wish they had used the record-low prices in options recently to begin hedging against general market risk.

