The gold price has risen about 20% since I wrote “It’s Time To Get Greedy In The Gold Market” but it looks to me like it could now get really exciting for gold bulls.
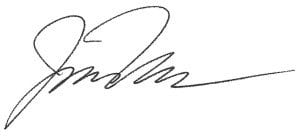
On the weekly chart there is now a clear head and shoulders bottom pattern in play. A break above the neckline would confirm the pattern and project an eventual target near $1,650. There is also a very interesting price analog from 2008-2009 (hat tip, @ECantoni) that suggests this breakout could be imminent.
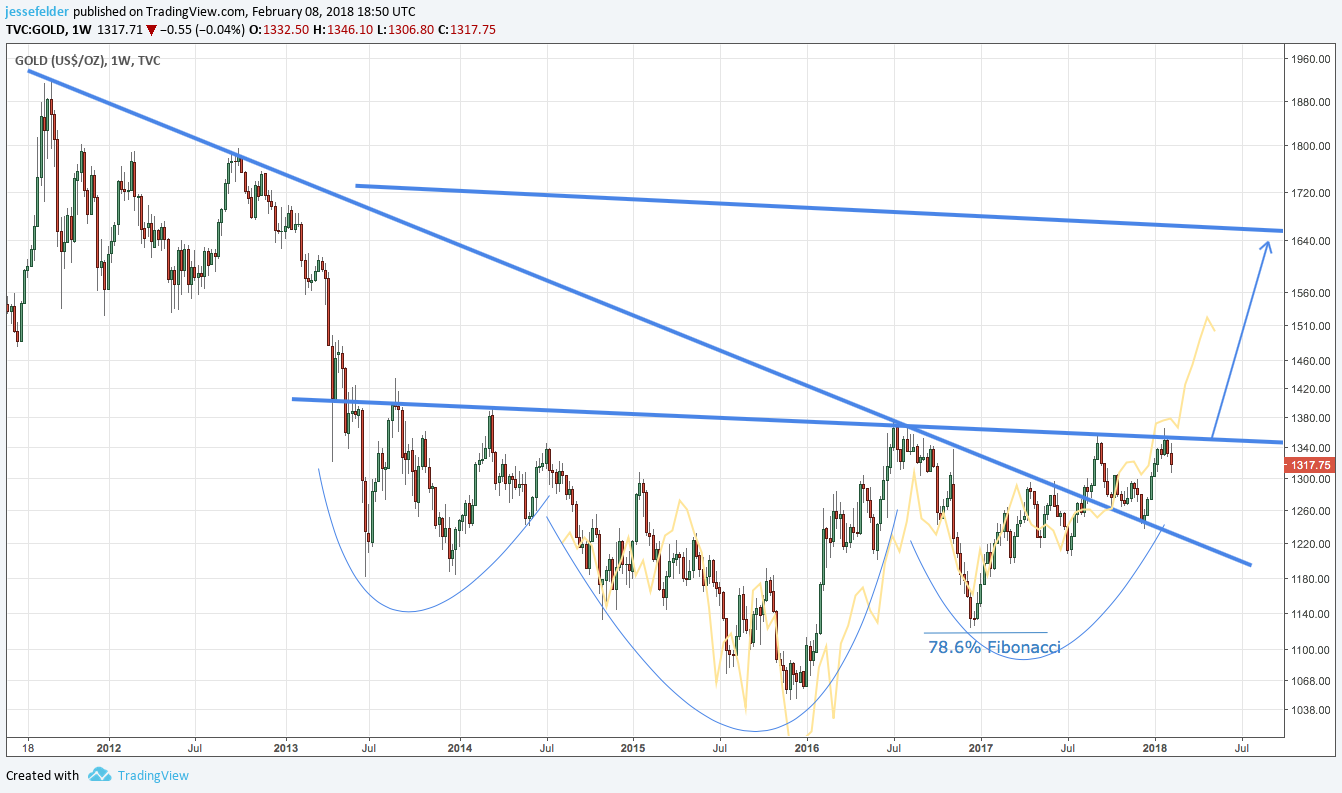
Since it’s peak in late-2011 gold has acted very much like it did from 1996-2002 (hat tip, @NautilusCap) at least relative to the broad stock market. There is a 97% positive correlation between the past six years in the gold/SPX ratio and that earlier 6-year period. In fact, it now looks like the gold/stocks ratio could have some serious catching up to do to the upside.
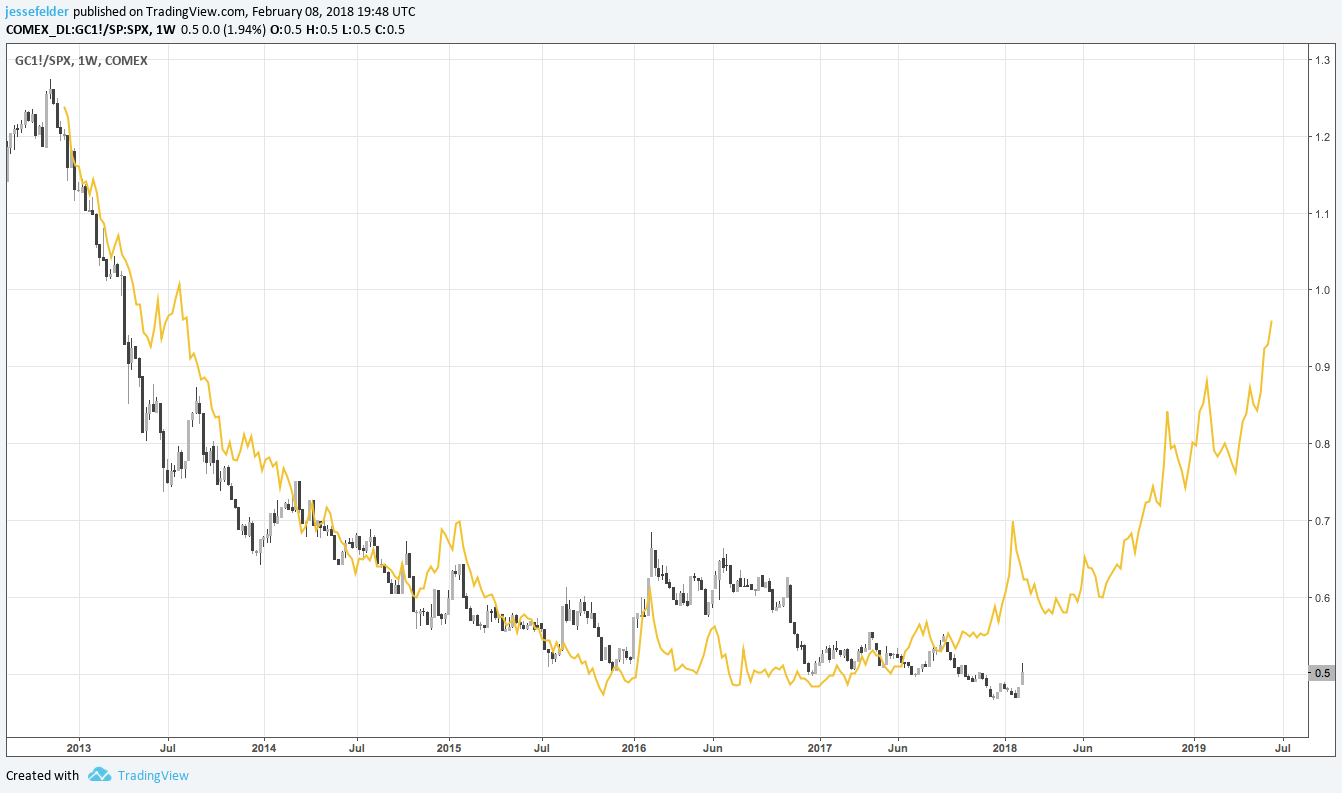
Looking back to that 2001 low in gold it’s clear that, at the time, it was very cheap relative to the broad stock market. Today, you could argue it’s now even cheaper. Over the past 35 years or so, gold and the S&P 500 have essentially traded around parity. Should they see some sort of mean reversion now there are $1,300 points to be made up one way or the other.
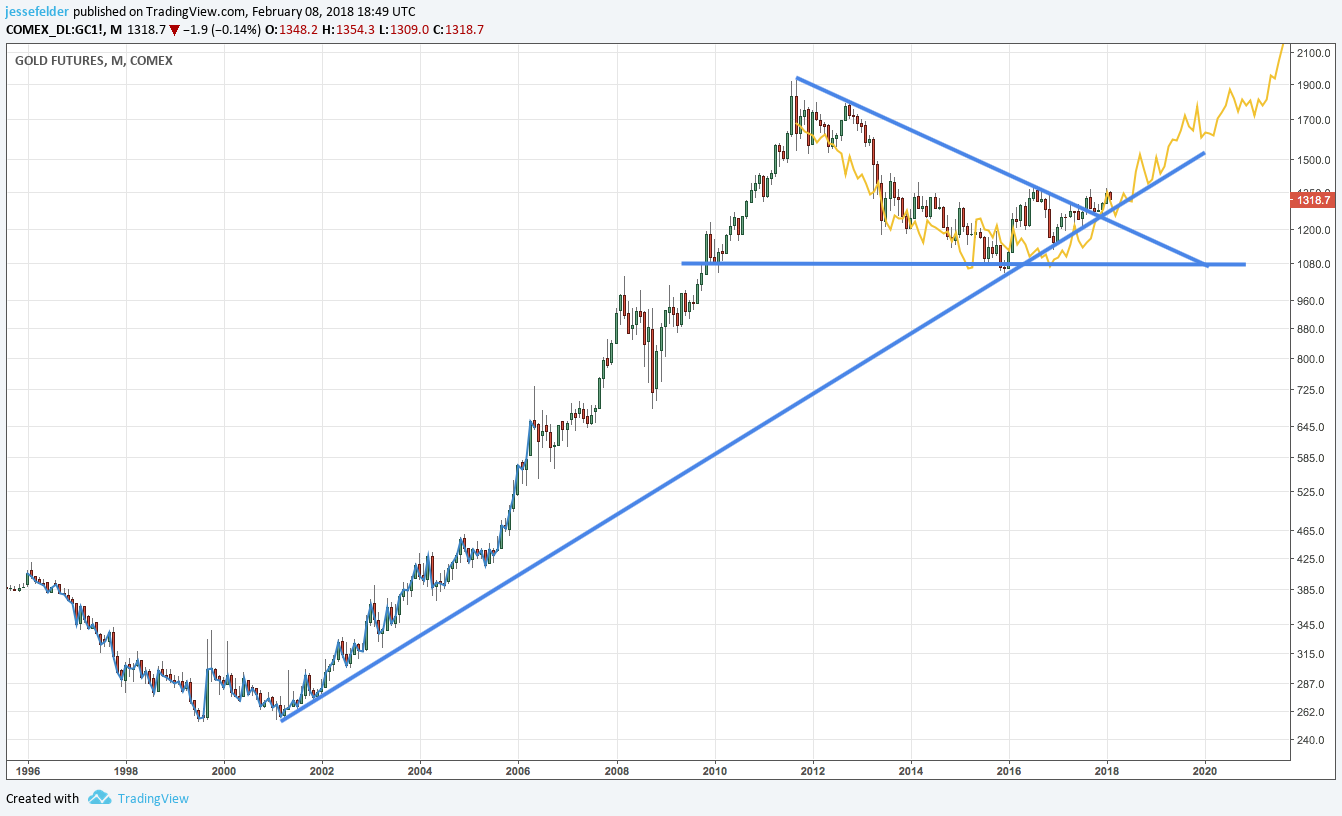
And if the future for gold rhymes at all with the early-2000’s period it could have much more upside over the next several years than even that head and shoulders bottom pattern would suggest.
Generally, I believe it’s important for investors to have significant exposure to real assets like gold at all times if only for the purposes of diversification. Today, there is a good technical case, as well as a fundamental case, for investors to overweight the precious metal.