The following is a transcript of the speech I was supposed to give to the Puget Sound chapter of the Market Technician’s Association on December 15, 2016 (before I got snowed in) and finally delivered last week:
Thank you for having me, Tom [McClellan]. It’s an honor to be invited to speak to you and your group today. I’ll say I do feel a bit out place since I’m mainly a fundamental guy or, as you technicians might call me, a “funny mentalist.” In truth, I consider myself a “jack of all trades, master of none” so it feels strange to be asked to speak about any one topic, really. That said, the markets have been a lifelong passion of mine and I might have some wisdom to share even if it’s only from the lessons that can be drawn from my many mistakes.
Why do we trade? Why do we invest or venture into the markets at all? Of course this answer is different for everybody. Some just want to enhance their savings – totally understandable in a world of ZIRP. Some have retirement goals they’re trying to meet. Some of us have other reasons. I didn’t really understand what made me so passionate about the markets until I watched ‘Trader,’ the PBS-produced, internet-banned video of Paul Tudor Jones recorded in early 1987. In the video, Paul tells us what first attracted him to the business:
Now I didn’t have a friend like that in college. I actually discovered my passion for the markets well before that time in my life but that’s exactly how I felt about the markets when I first heard about them. It was 1982 and I was 8 years old and my dad bought an Apple IIe computer. He also bought a game called “Millionaire” which was a very, very primitive stock market simulator. I don’t think video game creators today could come up with something more boring if they tried but, at the time, it was a revelation for me. Check it out:
Thanks to this stupid game I got the bug and it’s had a strong hold on me ever since. But it’s one thing to play a stock market simulation and something else entirely to make real money in the markets. Obviously, everyone would love to become a market wizard like PTJ, but it’s the process of going from an amateur aficionado to becoming a successful trader or investor that is the mountain that we’re all trying to climb. And it requires exactly this sort of passion for, in his words, “the most exciting, the most challenging game of all.” Because without that passion you’ll never be able to endure all of the mistakes, losses, trials, tests, the markets will inevitably put you through.
Probably the biggest mistake I see traders make is simply trying to be Paul Tudor Jones. I don’t mean they’re trying to be, ‘the next Paul Tudor Jones;’ they’re trying to be him. The great part about this game, though, is there is more than one way to win. You don’t have to do it Paul’s way or any other market wizard’s way. In fact, there are countless ways. Part of this climb to peak performance in the markets requires that you find, develop and cultivate your own unique style that suits your individual values, quirks, strengths and weaknesses.
Every time I’ve failed in the markets it’s been because I’ve tried something that doesn’t quite suit my own sensibilities. I was trying to be something I’m not. Conversely, every time I’ve found success in the markets I have done so on my own terms. Yes, I have learned from and been inspired by a great number of successful traders and investors but my goal has always been to take away from them that which resonates with me and find a way to integrate it into my own process.
So this is the story of how I found and developed my own style in the markets and I’ll start with the first really big mistake I made. It was the late 1990’s and I had been studying Warren Buffett and his investment process very diligently. I read all of his annual letters along with every book I could get my hands on. I was a fan and I had heard he had been buying Traveler’s stock. I looked into the company and it sounded like a pretty solid insurance company whose brand I was familiar with. You remember the red umbrella, right? It also appeared to be trading at a decent valuation so I bought some.
Over the next few months, the stock drifted lower and then during the height of the 1998 Long Term Capital Management crisis the share price fell about 50% from where I had bought it. I realized at that point I didn’t have much confidence at all in the position and I sold it in a panic. It wasn’t much longer after that time that Citibank announced they were buying the company and the stock gained back all that it had lost and then some. Is there another game you can think of that can so easily and quickly make you feel like such an idiot?
That was the point I realized I couldn’t be Warren Buffett. He knew the insurance business better than almost anyone on the planet. I didn’t know the first thing about it. If I was going to do better I needed to find a better way. I needed to find a way play to my own strengths and avoid, or at least ameliorate, my weaknesses. Though I had been investing for about a decade at that point (and pretty successfully – it was hard not to in the 1990’s), this is really where my journey to develop my own process began.
Now, because you guys are technicians I won’t bore you with the “funny mental” side of my process. In a nutshell, I like cheap stocks that offer a “margin of safety” and above-average returns. Thanks to Buffett, Ben Graham has made an indelible impression on my psyche.
I’m also a natural contrarian. I have been since I was a young kid. My mom tells me I never failed to vomit whenever she took me to a crowded place. To this day, I don’t go to movie theaters, concerts or any other crowded venue unless I have a VERY compelling reason to do so. Hell, I live in Central Oregon, also known as the middle of nowhere. The point is contrarianism fits me like a glove and, on the flip side, trend-following is my greatest challenge.
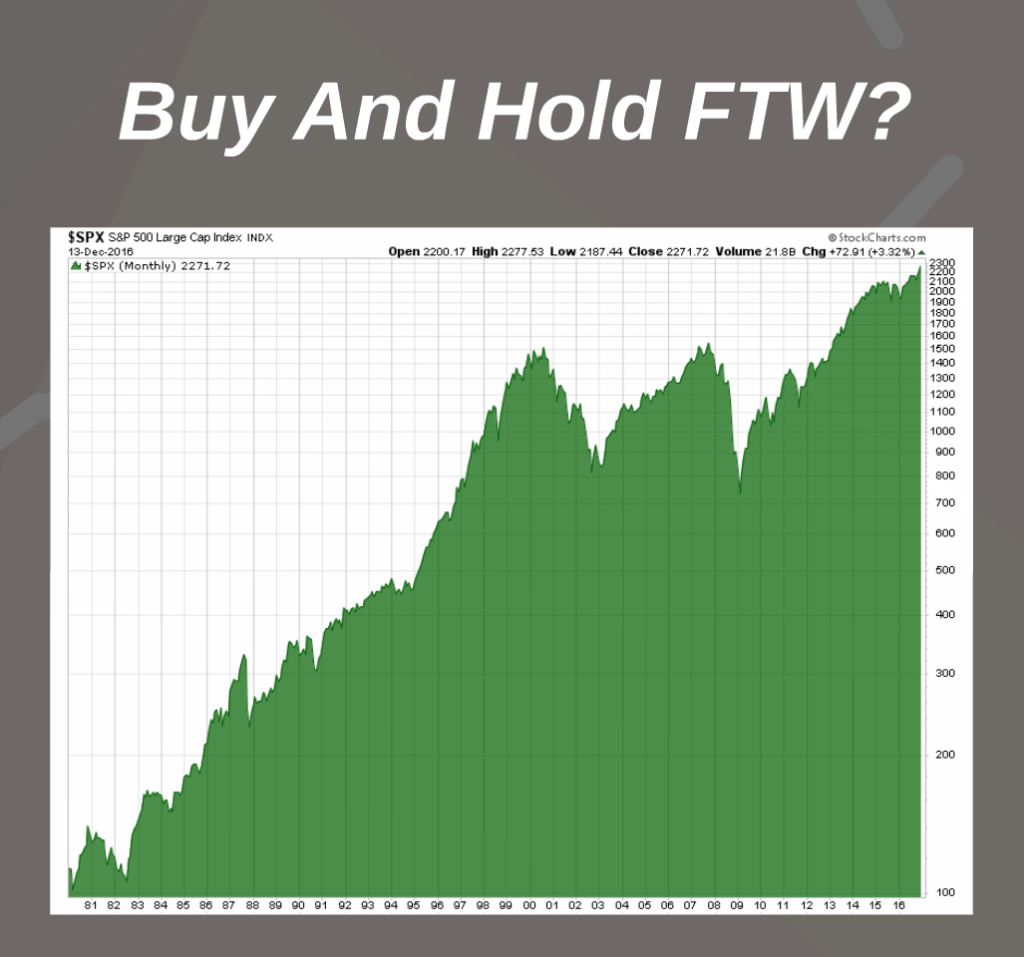
The trouble for me was I understood that most money was made in the markets riding the big trends. If I couldn’t do this naturally, how on earth would I ever be successful? Well, once I started studying the greatest investors and traders of all time, I realized that this popular buy-and-hold myth simply wasn’t true. To quote Paul Tudor Jones, “I believe the very best money is made at the market turns. Everyone says you get killed trying to pick tops and bottoms and you make all your money by playing the trend in the middle. Well for twelve years I have been missing the meat in the middle but I have made a lot of money at tops and bottoms.” Now think of any of the most famous investors of all time and the trades that made them famous and you’ll understand what he’s saying.
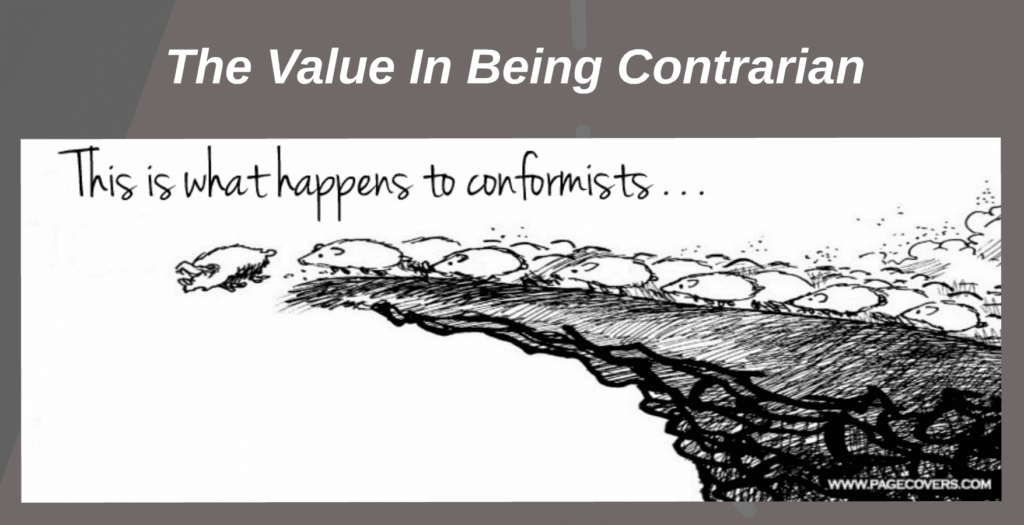
Jesse Livermore made $100 million short selling stocks into the 1929 stock market crash. That’s a hell of a lot of money in today’s dollars. And he didn’t make that much for a fund he made it for himself. Paul Tudor Jones, in very similar fashion, shorted stocks into the 1987 crash. George Soros and Stan Druckenmiller broke the Bank of England. John Templeton shorted $100 million of dotcom IPO’s in early 2000. Michael Burry shorted subprime mortgages in 2007. These were not popular trends when they put these trades on. Just the opposite. These trades went entirely counter to the popular consensus. In other words, they profited from the lemmings running off the cliff.
Now set aside short-selling. As I said, there’s more than one way to make money in the markets. Warren Buffett’s greatest trades were all deeply contrarian, too. Berkshire Hathaway was a failing textile manufacturer when he took it over but over the last 49 years it has returned 1.7 million percent on his original investment. John Templeton invested heavily in Japan after World War II, a wonderfully contrarian trade that paid off huge. During the savings and loan crisis Peter Lynch invested in a ton of “thrift conversions,” another uniquely contrarian opportunity that consistently paid off and paid off big.
The point is that the greatest opportunities to make money in the markets are those that are the most shunned. Yes, you would have done fine with buy-and-hold over the past fifty years but you would have also had to endure some massive drawdowns on your way to earning average returns. The real money is not made this way. The real money is made at those points in time when the crowd is dead wrong. This was something I was very excited to discover because going against the crowd or at least into areas the crowd shied away from was something that came very naturally to me.
Of course, the problem is the crowd is right most of the time. And not just most of the time, the vast majority of the time. So trying to determine when the crowd is right and when it’s wrong is a very difficult business. Study any of the trades mentioned above and you’ll quickly learn just how difficult it is from both a technical and emotional standpoint. The pitfalls to your pocketbook are many as are the demands on your psyche and that’s a huge understatement.
Study those trades mentioned above and you’ll also learn that in order to be successful you need a lot of things to line up. You need a great breadth and depth of both fundamental and technical factors working in your favor. As I said earlier, I won’t bore you with the fundamentals. But a little over a decade ago, I discovered a number of technical tools that for me, represented my “AHA!” moment.
They say every picture has a story to tell and this is as true in the markets as anywhere else. Charts are a visual representation of fundamentals and sentiment. The candlesticks tell a story about supply and demand. The easiest or most straightforward way to understand this is through momentum. When momentum is very strong it simply means supply and demand are greatly out of balance. A waterfall decline is supply greatly outpacing demand and a strong upwards surge is demand greatly outpacing supply.
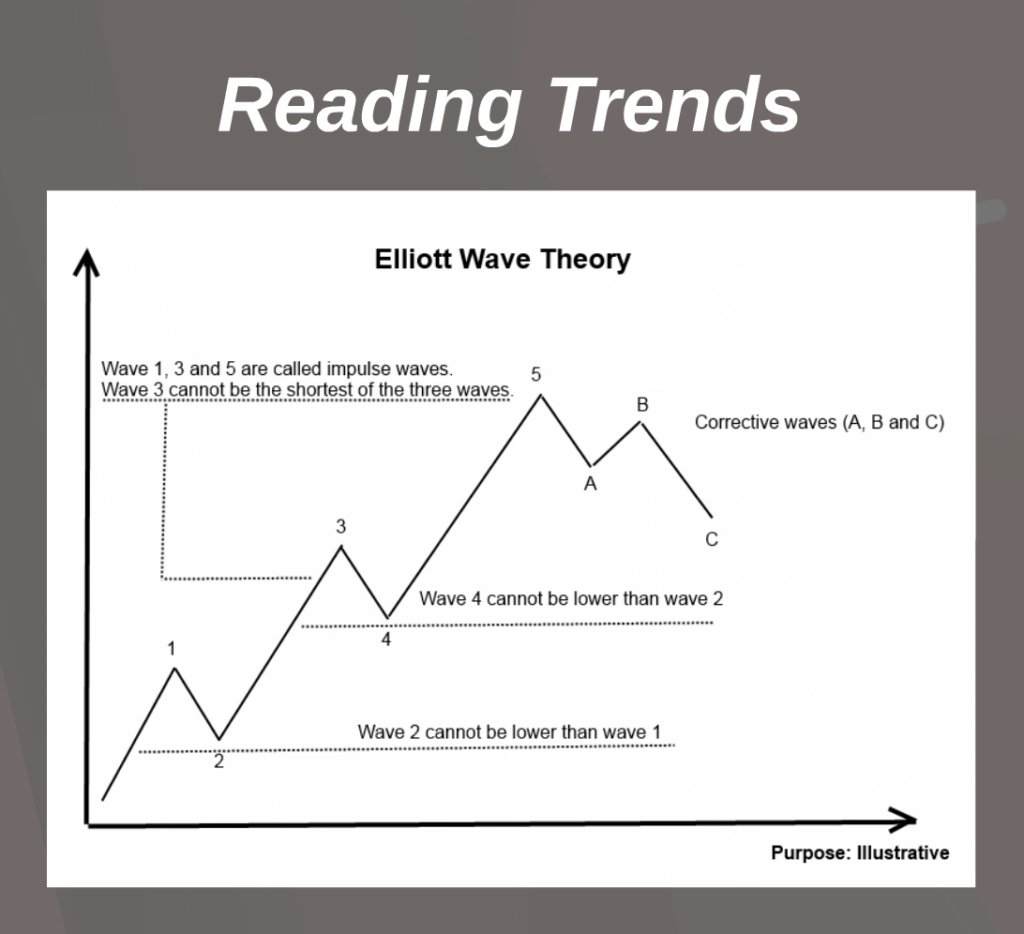
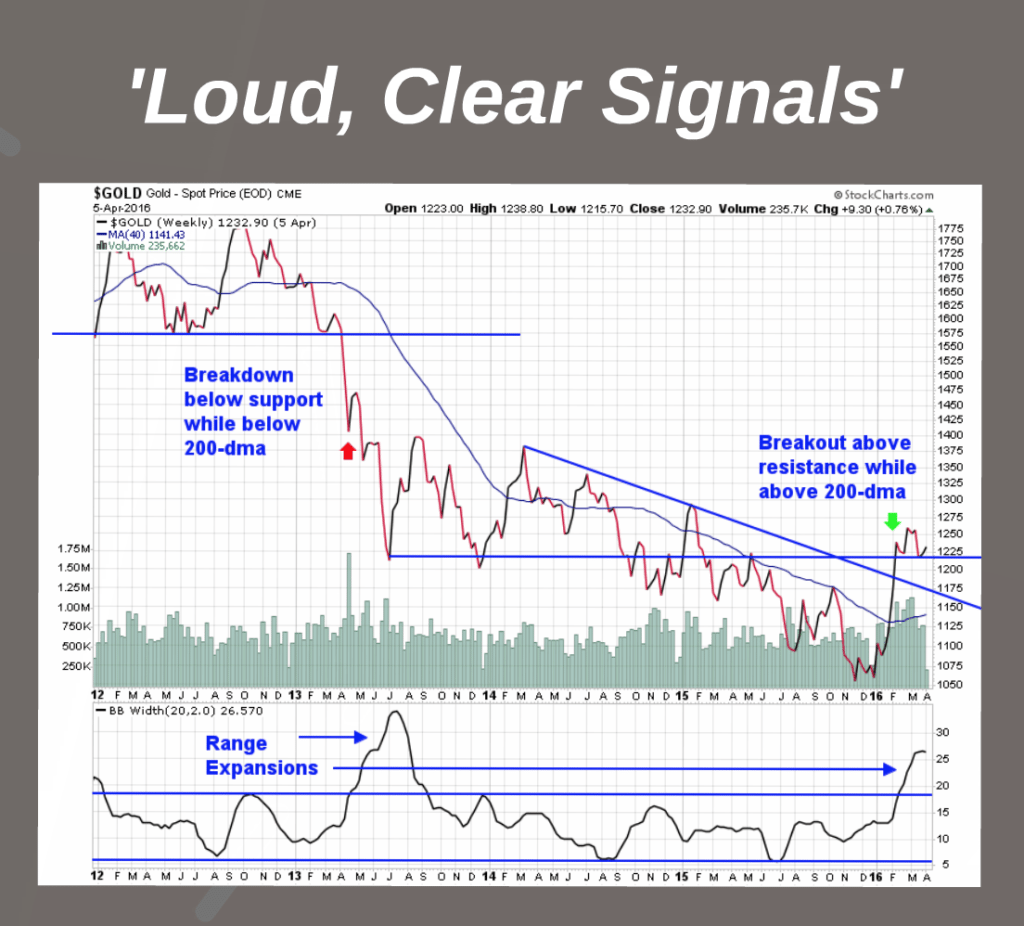
In Elliott Wave Theory they call these impulse waves. And impulse waves are normally a clear indication of the prevailing trend. To quote my man PTJ again, “When you get a range expansion, the market is sending you a very loud, clear signal that the market is getting ready to move in the direction of that expansion.” Powerful moves are a sign of a powerful trend and I recently used this simple analysis in looking at the gold market.
In the spring of 2013, gold had a powerful move lower, an impulse move that broke down below key support. Bollinger Band width exploded higher suggesting this was a very powerful impulse wave or range expansion. Then, in the spring of this year, the gold price moved strongly higher in a mirror image of that earlier break down. I take this to mean that the larger trend has now reversed from bearish to bullish. That remains to be seen but I still believe that the strong move higher this spring was an impulse move and the recent selloff more of a corrective move. Time will tell.
So the simplest way I use technical analysis is just to understand the trend. And just adding this component to my fundamental process has been incredibly valuable. Again, I’ll quote PTJ: “The inability to read a tape and spot trends is also why so many in the relative-value space who rely solely on fundamentals have been annihilated in the past decade.” Understanding the trend is critical for “funny mental” folks like me in avoiding annihilation in the markets.
It’s especially useful for contrarians who care to avoid being trampled by the crowd. For me, avoiding annihilation means refraining from going against a powerful trend. It means not buying something that’s in a waterfall decline. It also means holding on a bit longer to trade that is working even as the crowd begins to really embrace it so long as momentum remains strong. It means being patient and letting the market tell you when it’s time to bearish and when it’s time to be bullish.
As opposed to impulse waves, Elliott Wave also teaches us that corrective waves are those that move counter to the prevailing trend and are not nearly as strong as impulse waves. In an uptrend they might represent a period of time in which supply outpaces demand but only marginally. Prices just meander lower rather than plunge. In technical terms, we might call this a “bullish flag,” that just works off an overbought condition in between impulse waves.
Once you can understand impulse waves and corrective waves, you can also start to understand how trends reverse and how we might take advantage of herd behavior. When an uptrend starts to lose its impulse waves and upward movements come in more of a corrective fashion, it can be a sign that the trend is getting tired and may be ready to reverse. This works in reverse, as well, and as a fundamental investor this can be very valuable in looking for stocks trying to make a bottom.
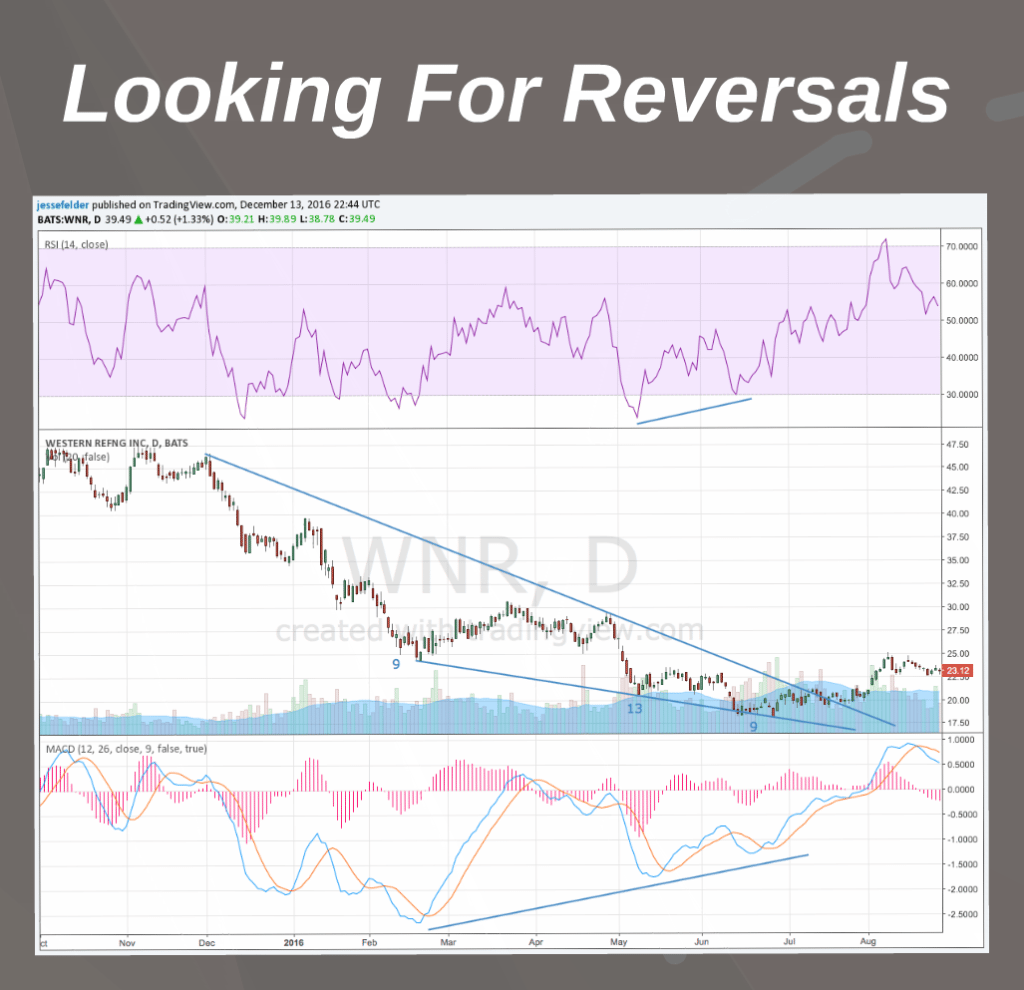
Western Refining is a stock I bought over the summer after the sector had been hit pretty hard and had fallen out of favor with investors. I first noticed it when a group of insiders all stepped in to make large individual, open-market purchases. Some fundamental research suggested it was cheap relative to its peers and relative to its own historical valuation. But the chart is what I used to really confirm these ideas about fundamentals and sentiment.
Looking at the daily chart you can see that the strongest impulse moves came in December through February with another pretty strong move lower in early-May. From then on, though, the stock made new lows but momentum to the downside waned pretty dramatically. By waning momentum, I’m referring to diverging RSI and MACD along with the “ending diagonal” pattern it formed during this process – the downtrend i the lows was not quite as steep as that in the highs. There were also DeMark Sequential buy signals triggering at the time, suggesting the downtrend could be exhausting itself.
To me, this sort of waning momentum in a downtrend, as indicated by traditional momentum studies, along with DeMark exhaustion signals and classic reversal patterns, confirms the idea that the supply and demand imbalance in the shares is potentially reversing itself. In other words, supply is running out of steam and demand could soon overpower it. In Western Refining’s case this is just what happened. The stock eventually formed a head and shoulders bottom pattern that projected to about $42 per share. Last month Tesoro announced they were buying the company and this upside target was nearly fulfilled.
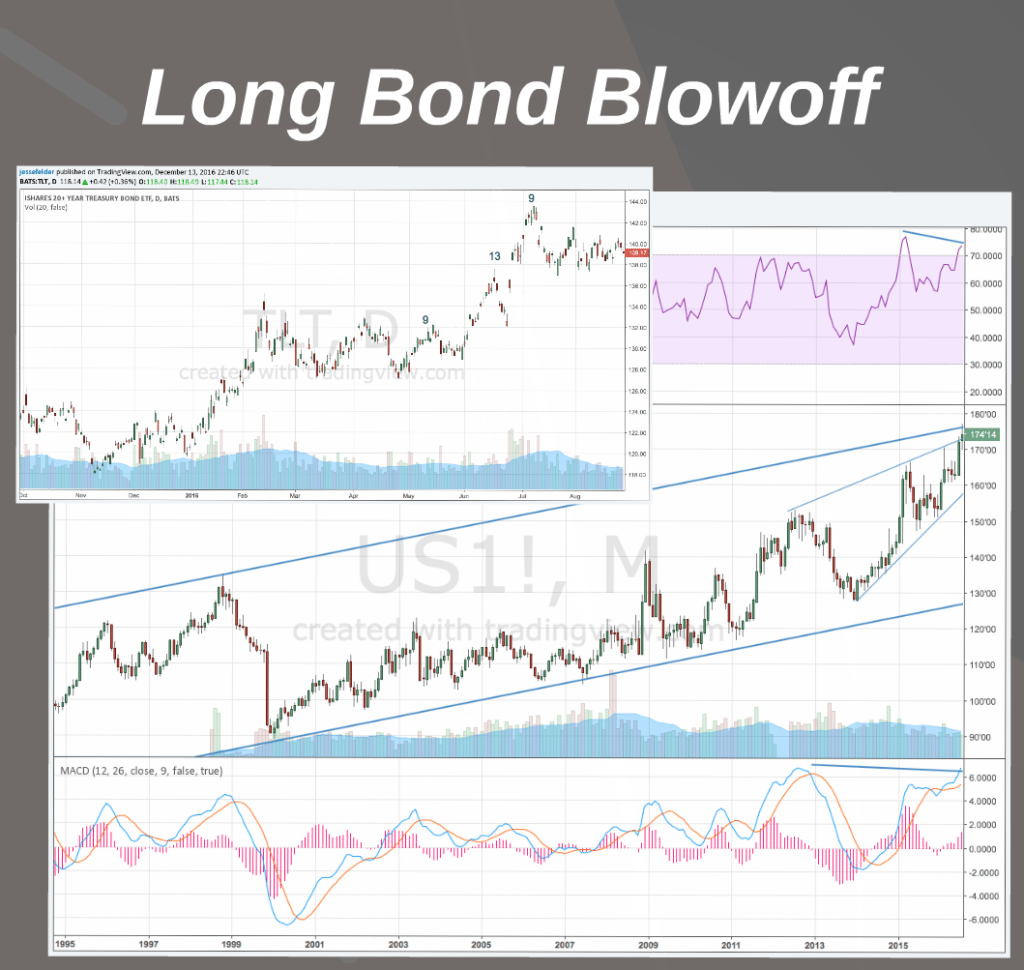
This works well on the other side of a trade, as well. After being bullish on long bonds for quite some time, I turned bearish in early July of this year. Because they had had such a great run, sentiment had gotten very, very bullish. At the same time, bond prices had gone way too far and momentum, at least on the longer-term time frames, was waning. Have a look at the monthly chart and you’ll see it bumping its head against the long-term uptrend line in the midst of another ending diagonal or bearish wedge. Momentum indicators like RSI and MACD were also diverging in a bearish manner. And while momentum looked strong on the daily chart, it was just completing a DeMark Sequential 9-13-9 sell signal. Since this time TLT, the long bond ETF, has fallen nearly 20%.
So, while my process is mainly based on fundamental analysis and sentiment studies, I like to use technical analysis to try to improve my chances of success in investing. It’s a lot easier to ‘be greedy when others are fearful’ when the supply and demand picture in the market confirms your thesis. I like to use multiple indicators across a variety of time frames in looking for this sort of confirmation. The more the better. In my experience, timing can make or break a good investment idea. This is where technical analysis comes in and it’s certainly improved my timing and my overall batting average. Most importantly, the way I use it suits my personality and addresses my shortcomings which allows me to more confidently play this game I love to play so much. Thank you.

