About 10 months ago I wrote that I thought Apple was worth $114 to $128 per share (split adjusted). That day the stock closed at $72. Today it closed at $116, 60% higher. So this morning I sold it. Here’s why:
Fundamentally, the company has gone from being very undervalued to fairly valued in a very short period of time. (Note: Carl Icahn, who is a lot smarter than I am, says the company is worth $200 per share. I just don’t know how much of this is salesmanship/optimism and how much is cautious analysis.)
I know, I know, Apple is firing on all cylinders and will probably continue to do so. iPhone 6 is selling like hotcakes even before we get into the holiday shopping season. New products are in the pipeline and Apple Pay will probably be huge for the company.
But how much of this optimism is already baked in to the current valuation? At 5 or 6x cash flow, almost none of this was priced in. At nearly twice that valuation today I’m not so sure. Ultimately, at the current price I no longer have a margin of safety. Should the company stumble, and I’m not saying they will, there’s no reason the stock couldn’t go back to the $80-95 level (where I’d probably buy it back).
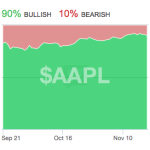
 And this is where fundamentals and sentiment get blurred. Clearly, investors don’t quite love the stock as much as they did during the summer of 2012 (will any stock be that loved ever again?) but they no longer think Samsung is going to eat the company’s lunch. So I wouldn’t say sentiment is super-frothy but a 60% run in 10 months tend to inspire at least a little euphoria and StockTwits sentiment has reflected that for some time. 90% of the messages on the site tagged with Apple’s ticker are bullish. That’s a pretty crowded trade.
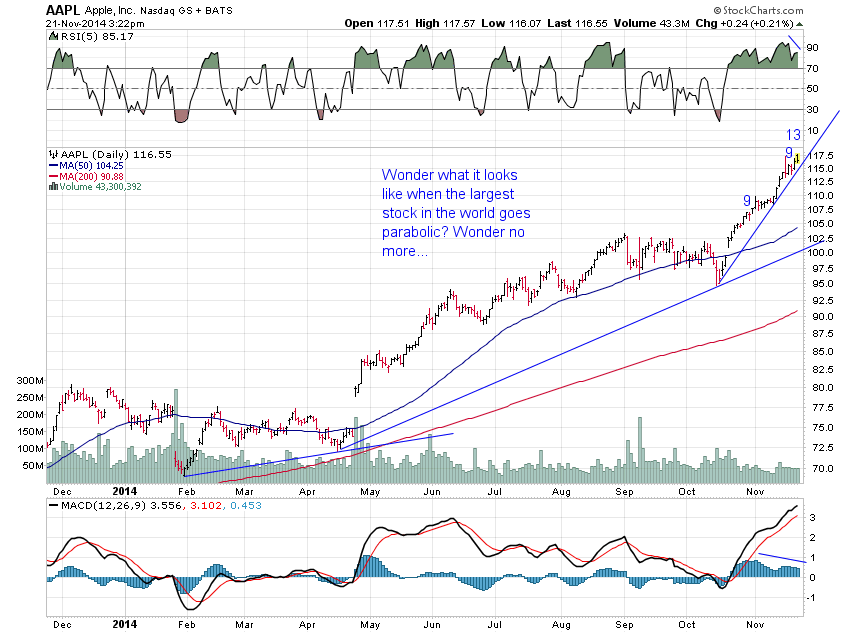
As for the long-term trend, clearly it’s still bullish. But there are some signs that it may be getting exhausted. DeMark Sequential sell signals are now triggering on multiple time frames. A daily 13 sell signal registered at today’s open while another 9 sell setup triggered a couple of days ago. All this means is we are seeing a cluster of trend exhaustion signals currently:
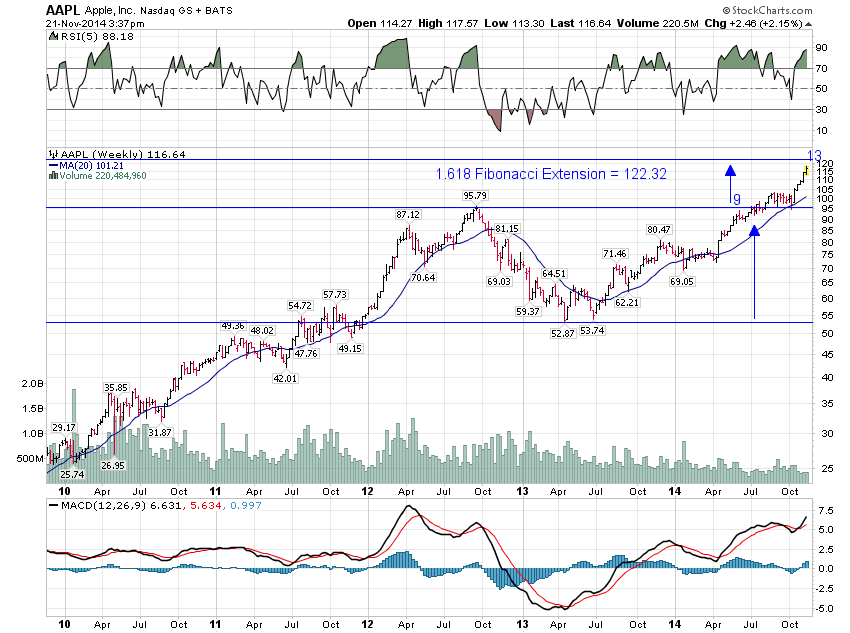
The weekly sell signal won’t trigger until the Monday after Thanksgiving but this time frame gives us a good look at the action over the past couple of years. The stock famously peaked in the summer of 2012 before losing roughly half its value into the spring of 2013. The stock has since rallied back and broken out above that prior high (taking the major indexes with it). A simple 1.618 Fibonacci extension projects a target of roughly $122.
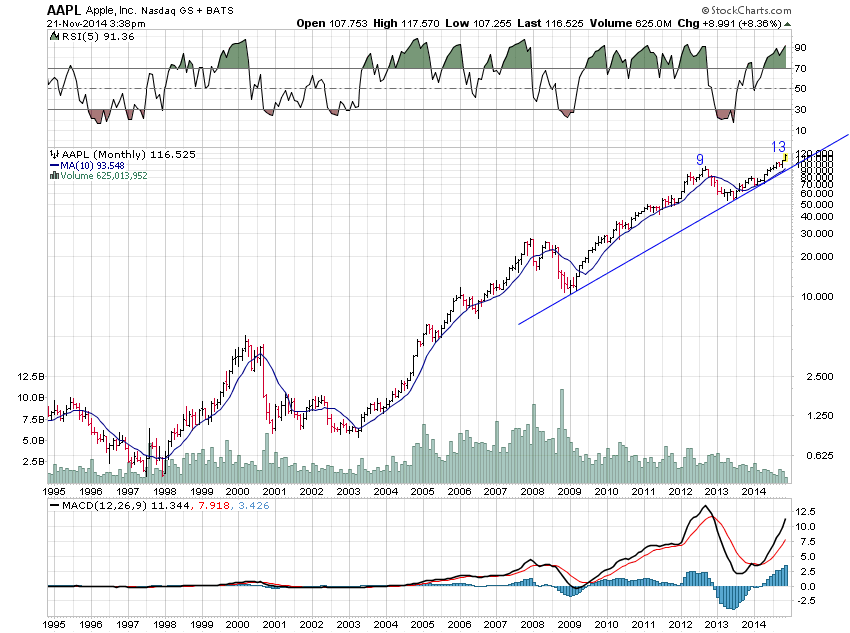
Interestingly, that 2012 peak was accompanied by a completed monthly DeMark 9 sell setup. Last month the stock triggered a monthly 13 sell signal off of that same setup. The risk level for this monthly signal sits at roughly $121. Coincidentally, that’s also the risk level for the daily signal. So according to DeMark Sequential analysis on multiple time frames, the stock could continue to run to $121-122 to test these risk levels and complete the 1.618 Fibonacci extension on the weekly chart.
From where I sit, however, the stock has pretty much reached fair value, sentiment has shifted positively once more with investors nurturing great expectations for the holiday season and the parabolic move over the past few weeks has triggered a flurry of sell signals. So I’m not saying this is the top. I’m just saying I’ve had my fun and the risk/reward equation no longer appeals to me.


