A couple of weeks ago I took note of the following tweet:
https://twitter.com/WildcatTrader/status/393515257097764865
It looks as if traders in Rydex Funds have recently become more bullish on stocks than they have ever been. The charts shows that money that has been poured into leveraged “bull” funds now outweighs the money in “bear” funds by a ratio of 8-to-1. In the past, 4-to-1 has been pretty extreme and we’re now double that level.
Not only is this a pretty good contrarian indicator it also raises questions regarding systemic risk to the stock market. If Rydex traders are this bullish it’s probably safe to assume that traders in leveraged ETFs are similarly bullish. Just a few months ago the Fed warned about the risks that these kinds of funds pose to the broader stock market and even went so far as to compare them to the “portfolio insurance” strategies that have been blamed for the crash of 1987.
Ultimately, the large amounts of cash committed to leveraged bullish funds have acted like financial steroids, powering the indexes higher than they would have been able to climb without these performance-enhancing funds. Should the market reverse trend it could fall victim to its own success as the unwinding of these trades magnify the downside in a bear market. Add a record amount of margin debt to the equation and you could be looking at the raw fuel for a pretty brutal selloff.
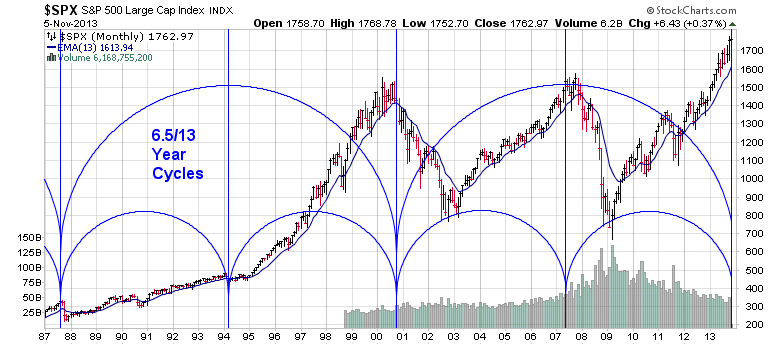
Chart of the Day:
Speaking of the 1987 crash, it’s interesting to note that a 13-year cycle (and 6.5 year cycle) lines right up with that stock market peak, the 2000 peak and today.