What do I mean by “worst possible environment”? I mean an extremely overvalued, over-bullish stock market that now finds itself in a downtrend.
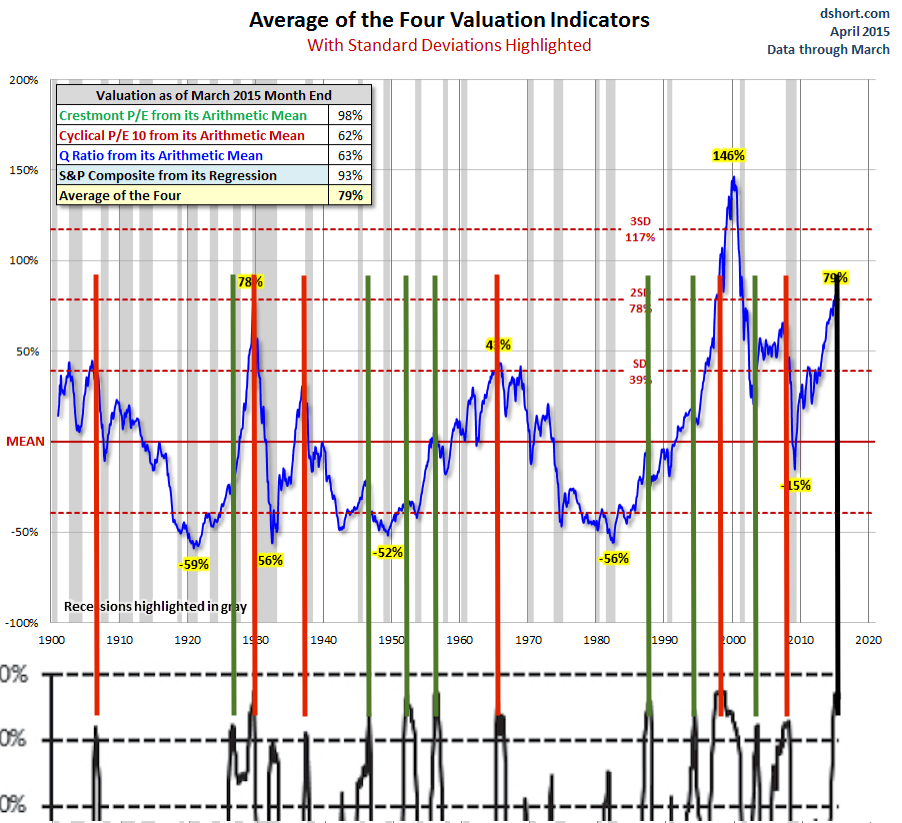
Let’s take a look at these individually. As for “extremely overvalued,” I prefer to look at Warren Buffett’s favorite measure of market cap-to-GNP. It shows that only during the height of the dotcom bubble were stocks more expensive than the are today. In fact, today’s valuations are roughly equivalent to November of 1999.
The reason I prefer this measure is that it’s very highly negatively correlated to future 10-year returns. The higher the valuations, the lower your forward returns. As Buffett would say, “the price you pay determines your rate of return.” Pay a lofty price and get a meager return.
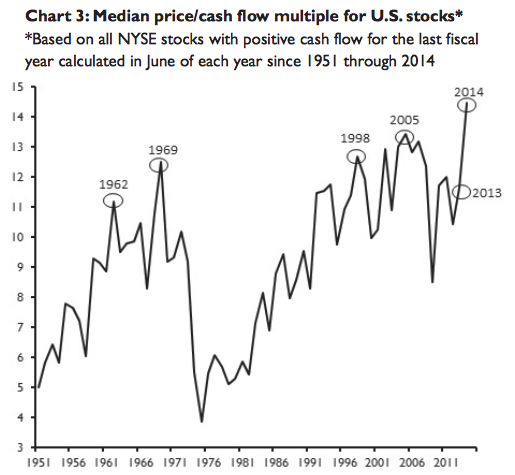
If you prefer price-to-earnings ratios, however, I would point out that the median p/e is even higher than it was during the dotcom bubble. In fact, it’s never been higher than it is today (since the chart below was created prices are about flat and earnings are down).
When I use the term “over-bullish” what I’m really referring to is the level of “greed” or “euphoria” built into the market. Yesterday, I demonstrated that leveraged financial speculation relative to overall economic activity recently reached a record high. In the past, this has not been good for stock prices. This is probably my favorite way to gauge longer-term sentiment because it is also highly negatively correlated with future returns. When speculation is high, forward returns are low or negative and vice versa.
There are a variety of other measures, though, that confirm the idea that investors in the stock market have perhaps never been more bullish than they are today. The Investors’ Intelligence Survey’s spread between bulls and bears recently hit record highs (and sustained them for quite some time).
Far from "hated," it may be more appropriate to call this, "the most loved bull market in history." pic.twitter.com/wcLNO9oz2T
— Jesse Felder (@jessefelder) August 18, 2015
Traders of Rydex Funds show similar record bullishness:
"The most hated bull market"? Hated by whom? pic.twitter.com/ibEO11zqAM
— Jesse Felder (@jessefelder) August 18, 2015
And for those who insist that retail investors have yet to join the party, there’s the ratio of equity-to-money market assets hitting record highs, as well.
Here's a chart for those who claim "investors have yet to embrace this bull market." pic.twitter.com/bIaK3z5IGw
— Jesse Felder (@jessefelder) August 18, 2015
All of this is likely attributable to the rare strength and duration of the uptrend over the past few years. When prices move almost straight up with very little volatility it tends to inspire a great deal of confidence and even euphoria. And this recent uptrend is, in some respects, the most confidence-inspiring in history.
We have never seen such a steady advance/lack of meaningful pullback in the history of $SPX http://t.co/MlTevUmPos pic.twitter.com/DzfcyHStF0
— Jesse Felder (@jessefelder) September 1, 2015
However, when these sorts of trend break, and especially while valuations are very high, it has always led to a bear market in the past (see “This Chart Suggests A Bear Market Could Be Lurking” for details).
How do we know the trend is broken? Well, there are a variety of ways to look at that. Most simply we can look at the uptrend line that dates back to the beginning of the bull market in 2009. Clearly, it has been decisively broken at this point.
Alternatively, we can use a 10 or 12-month moving average along with the 12-month rate-of-change. Both of these measures suggest the trend has now shifted from up to down.
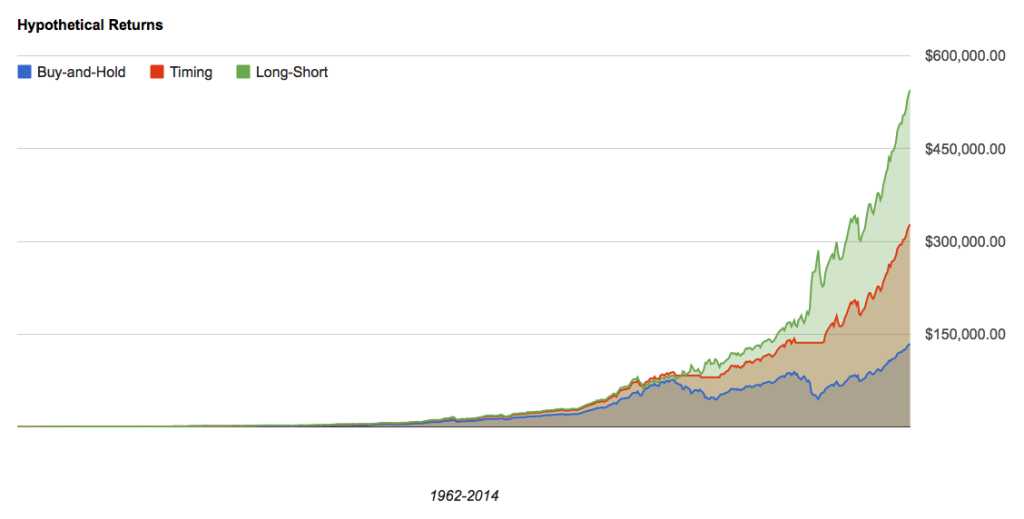
It was nearly a year ago that I looked back at times when stocks became “extremely overvalued” and then the trend turned down. In every case, it paid very handsomely for investors to implement a system that either shifted to cash (and avoided major drawdowns) or actually got short the major indexes (to profit from major drawdowns). (Please note that this study is hypothetical and just for educational purposes. Every individual investor needs to do their own due diligence and decide what methods and tactics best suit their own risk tolerance and goals.)
The point is that an extremely overvalued and over-bullish stock market that shifts from uptrend to downtrend is the sort of rare environment that has led to the largest declines in history. For this reason, it presents investors with the most dangerous of all possible environments.
