A year ago, I wrote a post called, “how to time the market like Warren Buffett,” in which I proposed a very simple market timing method inspired by this passage from the Oracle of Omaha’s 1992 letter to shareholders:
The investment shown… to be the cheapest is the one that the investor should purchase.… Moreover, though the value equation has usually shown equities to be cheaper than bonds, that result is not inevitable: When bonds are calculated to be the more attractive investment, they should be bought.
The idea is very simple and intuitive: When reliable measures forecast that stocks will outperform bonds, buy them. However, when, on rare occasion, they forecast that bonds will outperform stocks then they should be favored. But how to forecast equity returns? Simple. Just use Buffett’s favorite valuation yardstick, market cap-to-GNP. Right now this measure shows stocks to be about as highly valued as they were back in November 1999.

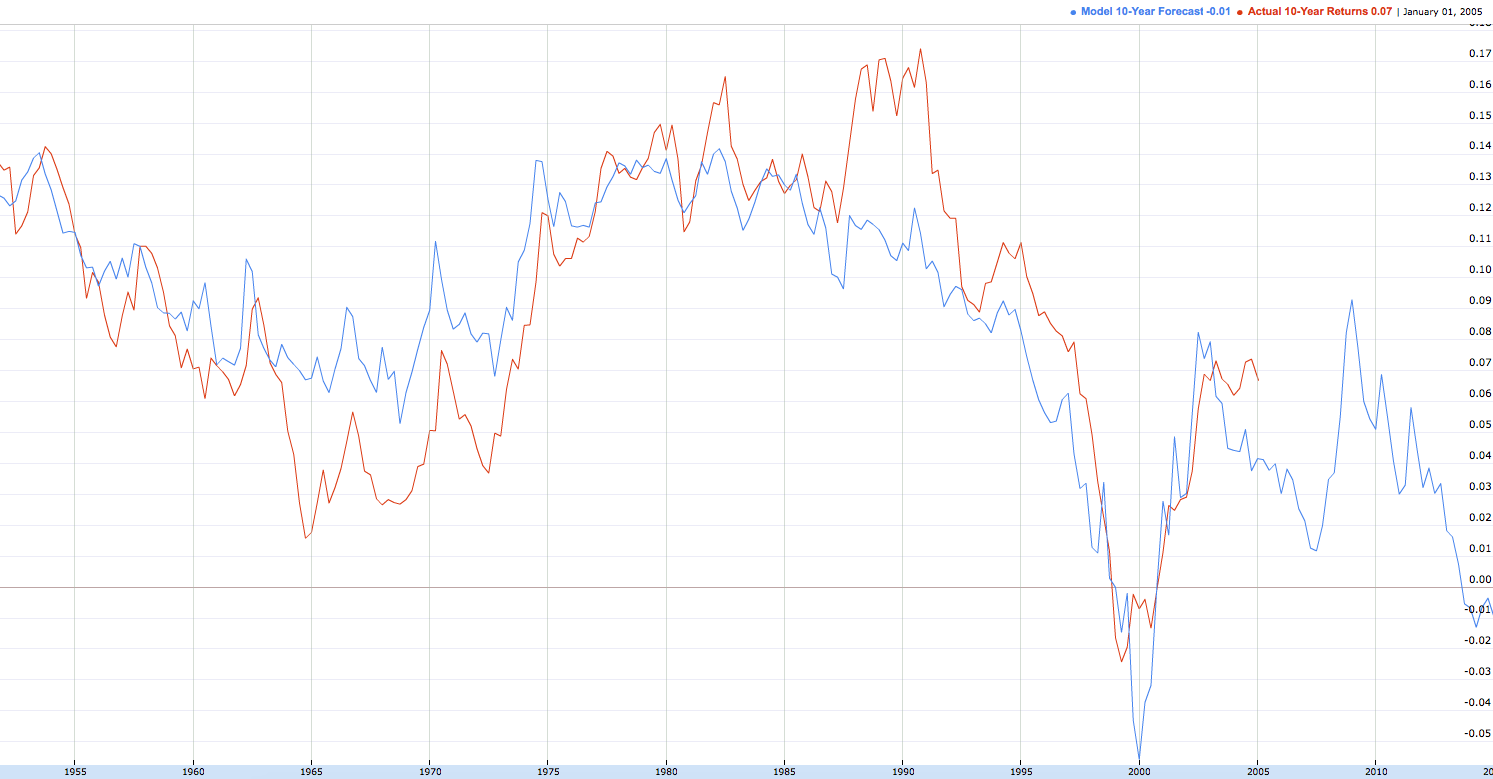
What makes this measure most valuable, though, is its forecasting accuracy – which may be what makes it Buffett’s favorite. Below is the 10-year forecast implied by this measure (blue line) against the actual 10-year return for the S&P 500. Notice the red line tracks the blue fairly closely but can overshoot in both directions, overestimating returns during the 1973-74 bear market and understating returns during the dotcom bubble.
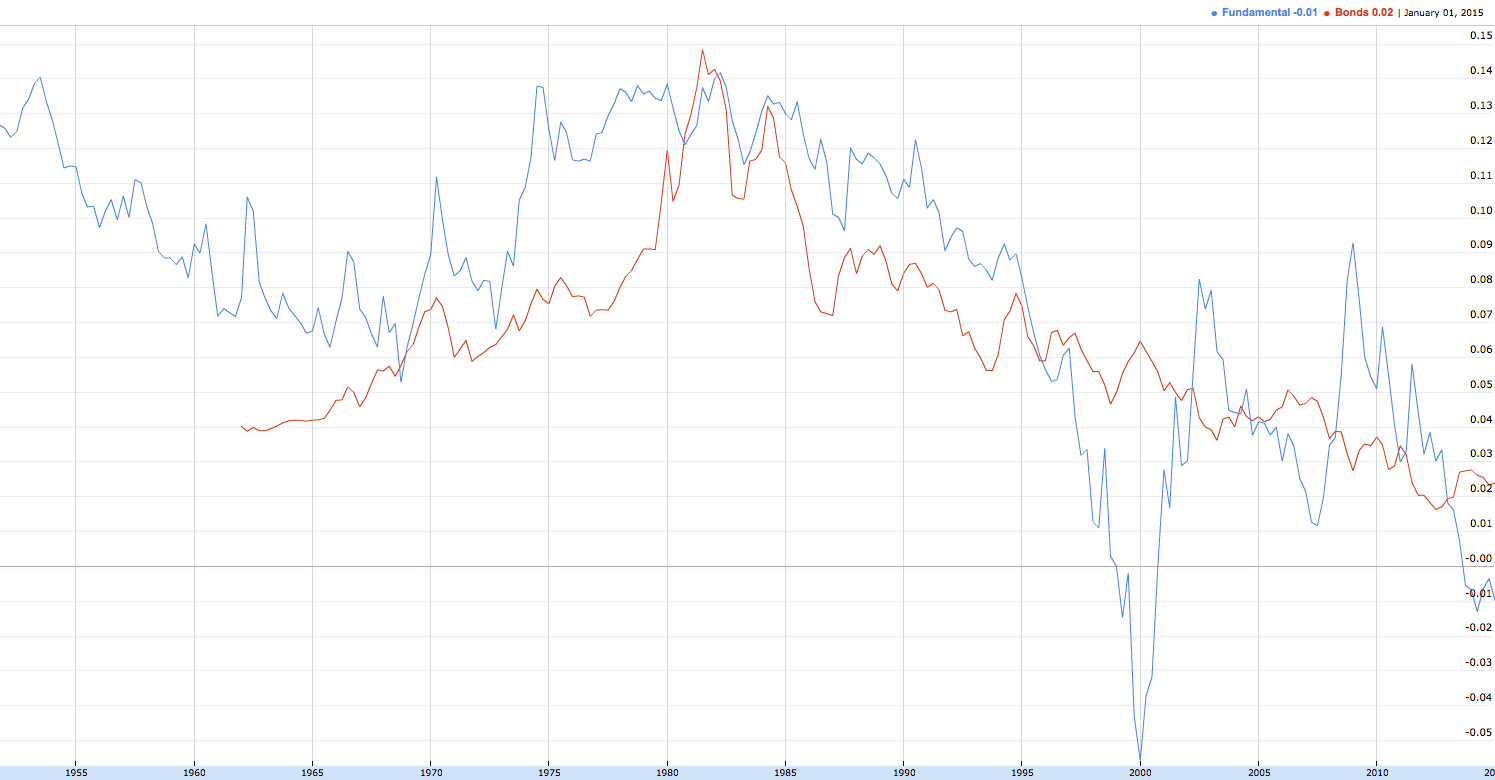
The next chart overlays the 10-year treasury bond yield (red line) against the 10-year forecast for stocks (blue line). The majority of the time this comparison suggests stocks are the better investment. There are few occasions, however, when bonds offer the better opportunity. Today is one of those occasions.
In my original post, I demonstrated just how attractive it would have been to follow this methodology. Since 1962, an investor who simply had bought stocks when they were more attractive and then switched to bonds when they became more attractive outperformed a buy-and-hold approach and dramatically so (mainly by sitting out a significant portion of the last two major bear markets).
What I think is most remarkable about the chart above right now is, at 3.05% (stocks’ forecast return of -1.07% minus a 10-year bond yield of 1.98%), it is signaling one of the largest spreads between forward returns on record. There are only a handful of quarters over the past fifty years that offered investors a better opportunity to switch from stocks to bonds. In fact, the last time the spread was this wide was during the second and third quarters of 2007, just prior to the financial crisis that led to a 50% drop in the stock market.
Now this doesn’t mean you should sell all of your stocks and run for the hills. Everyone has their own personal investment goals and risk tolerance and that should be paramount in their individual process. A practical way to implement this would be to simply underweight stocks and overweight bonds based on today’s reading. Or if you’re making significant new contributions to your account, maybe you just put those in bonds for now until stocks offer a more attractive opportunity. In fact, that’s probably how Buffett would do it. And though I doubt he uses these measures exactly this way, this sort of process has worked well for him for quite a long time.