We all spend a great deal of time analyzing valuations, technical patterns and sentiment in trying to determine if it’s a good time or bad time to buy or sell. I try to constantly tell myself, “keep it simple, stupid.” In that vein, there’s a much easier way of looking at the markets even if it means taking a very long-term view.
My friend @jesse_livermore recently wrote a terrific piece about the ultimate arbiter of market prices: supply and demand (go read it). This basic economic principle applies just as much to the financial markets as it does other prices. In fact, you can make a great case that the Fed limiting supply of Treasuries over the past few years has been a major factor in their incredible surge.
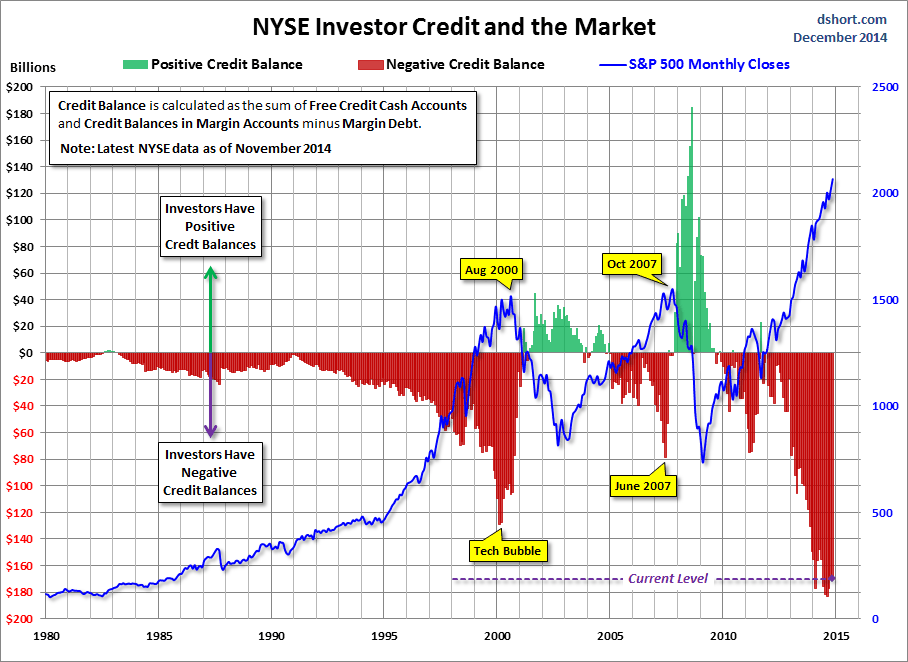
By the same token, there’s one chart that has stuck in my mind over the past year or so since it peaked. And that is the chart of total margin debt – more specifically, the chart of net credit balances in brokerage accounts:
 Chart via Doug Short
As you can see, we are currently witnessing the largest negative balance in brokerage accounts on record (second-most ever relative to GDP). Looking back over the past couple of decades it’s plain to see that stock prices have either benefitted or suffered from ebbs and flows in supply (stock for sale) and demand (stock for purchase).
The runup during the internet bubble benefitted from a massive amount of demand for equities fueled by rapidly expanding margin debt. Stocks peaked due, in some degree, to investors maxing out their ability to borrow and demand essentially dried up. Eventually, those shares they acquired during the bubble became supply and there was no new source of demand to soak it up. Prices were roughly cut in half.
Conversely, after the financial crisis, all the excess cash in brokerage accounts was converted to demand for equities which fueled the boom in prices during the beginning of the bull market. Then investors began to borrow and the growing margin debt once again pushed prices higher still. Now here we sit with record negative balances in brokerage accounts.
The simplest conclusion we can draw from the current levels of negative balances then is that there is currently record low potential demand for equities. In other words, the fuel for higher prices is running dry, if it hasn’t already (as I mentioned earlier margin debt levels peaked almost a year ago). Long term investors would do well to make a note of this and consider it in their long-term plans.
In the shorter-term, though, it’s probably worth noting that, on the flip side, there is also “record potential supply” for equities which can cause problems all on its own. Just take a look at what has happened recently to the price of oil. Massive new supply comes online (from the shale boom) and the price collapses about 60% in only 6 months time.
Now, I’m not saying the stock market will collapse. I’m just saying that should this potential “supply” come to market it could make for some very turbulent trading. (Another component of growing supply for equities comes from the IPO market, which last year nearly matched the record set in 2000.) And the potential for “demand” to save the day is very limited, at best.