

Total margin debt recently surpassed $1 trillion.
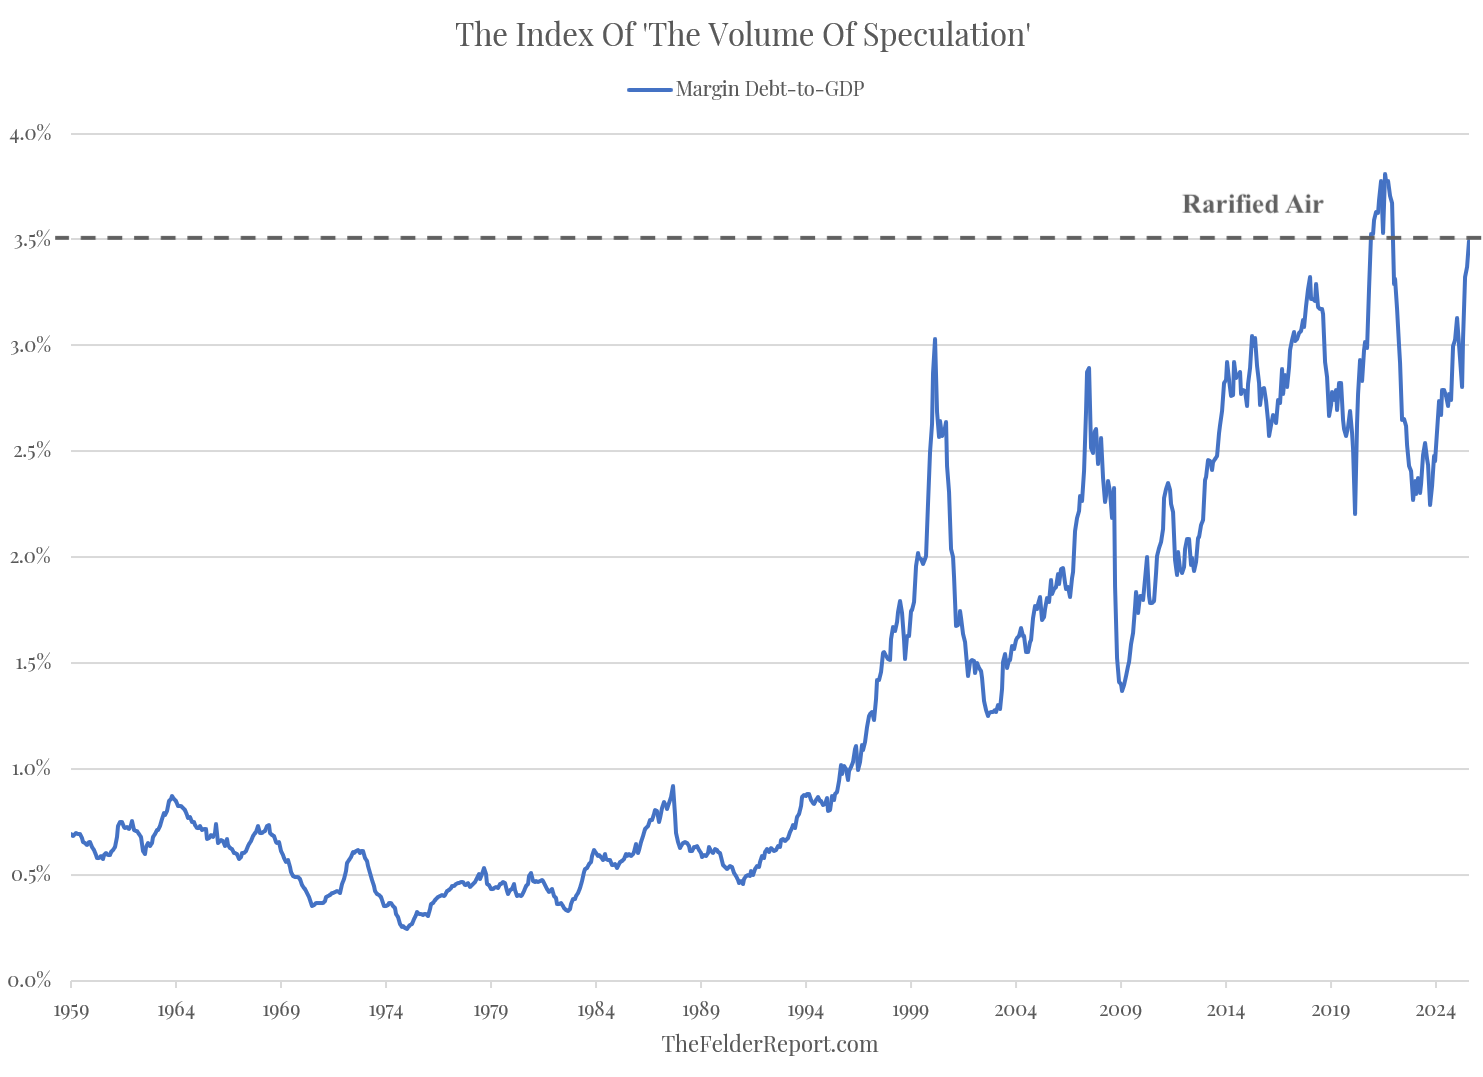
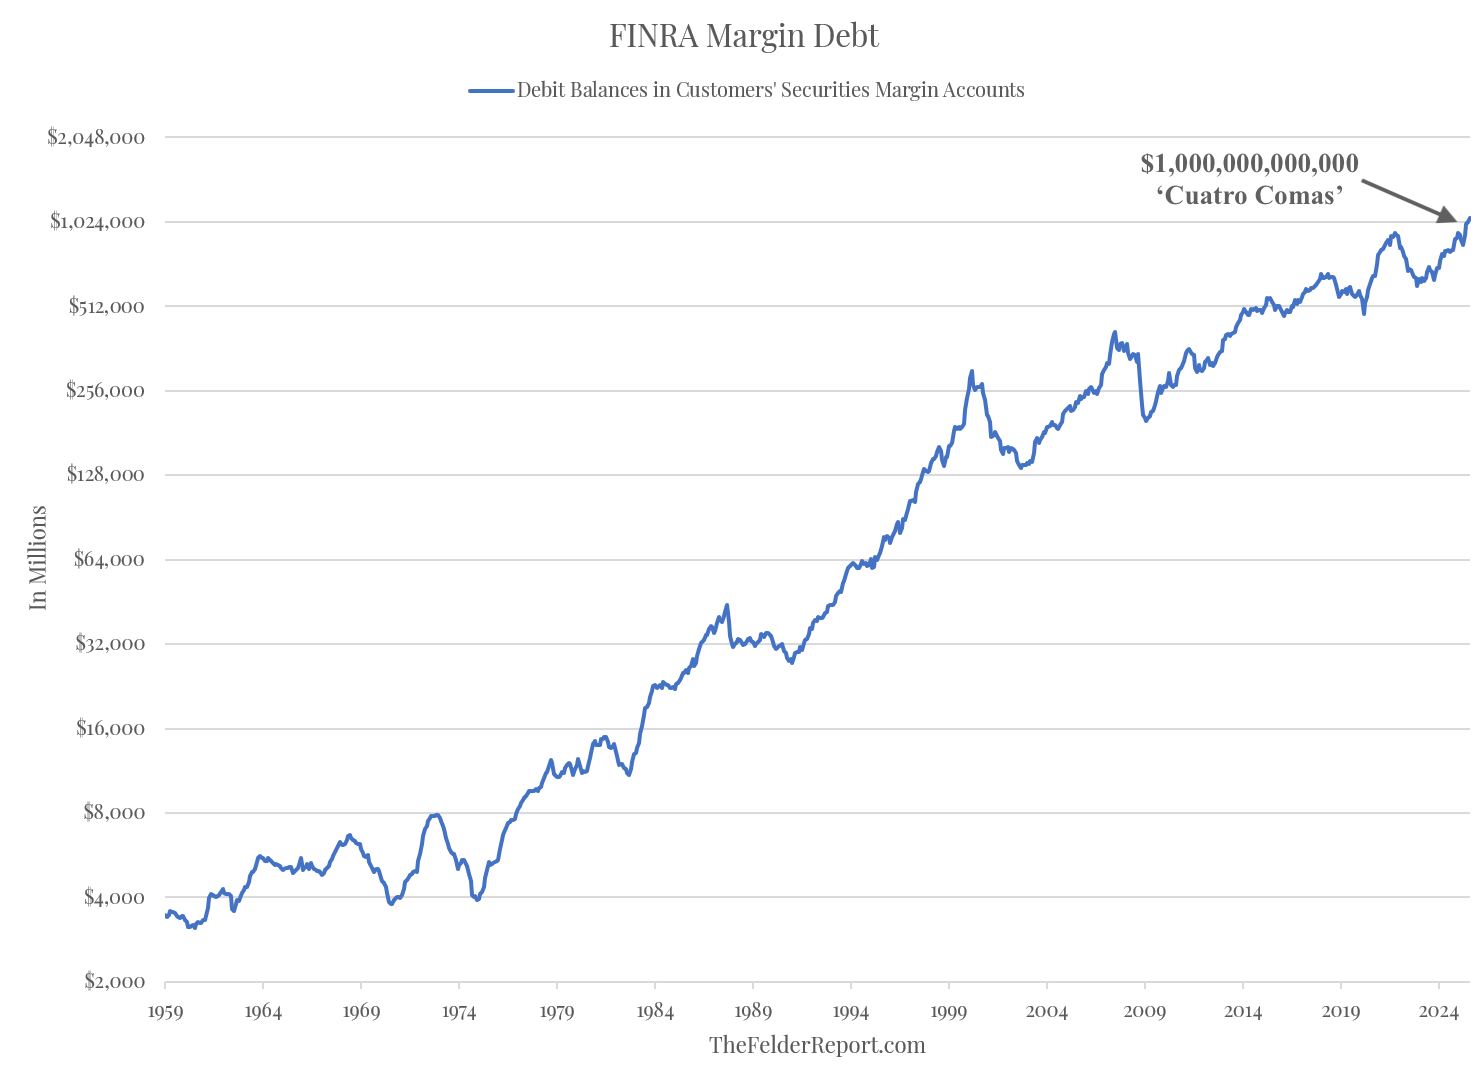 While crossing the ‘cuatro comas‘ mark puts margin debt firmly into the territory of the unimaginably large, it doesn’t mean much without putting into some sort of context. Comparing margin debt-to-GDP does that and it shows that, ‘the volume of speculation‘ is more extreme than any time outside of the apex of the meme stock mania of 2021.
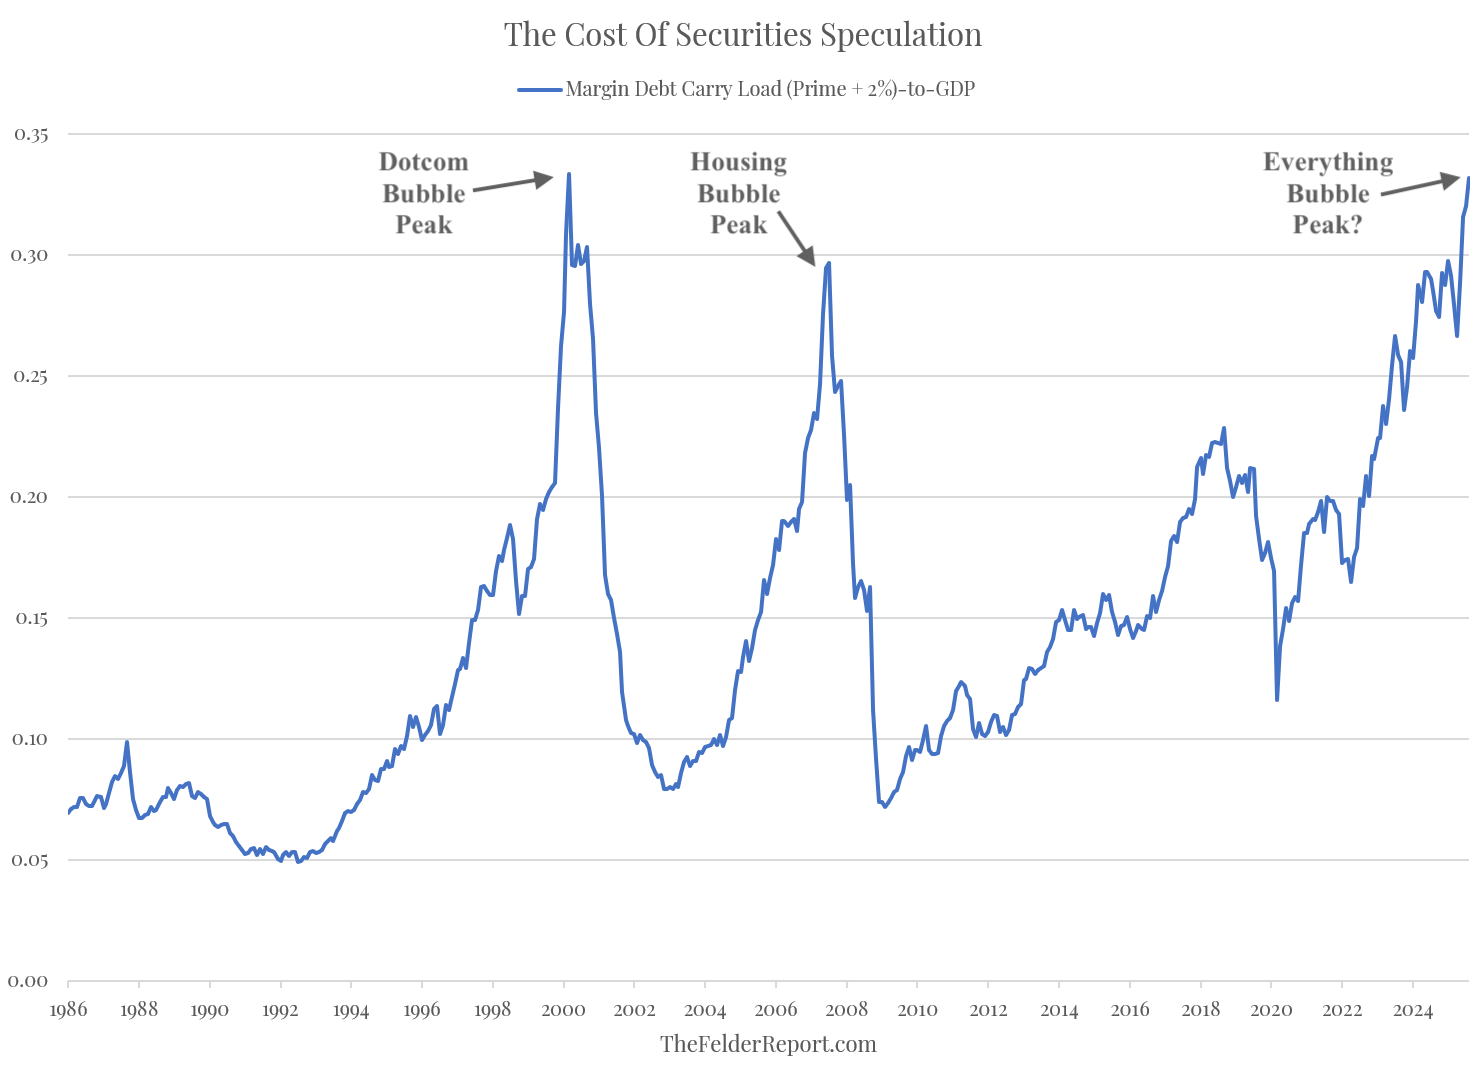
Another way to put this figure into some context is to look a the “carry load” of margin debt, as Investech puts it. This compares the interest cost (assuming the prime rate plus 2%) of margin debt to the level of economic activity. This measure of the total cost of speculation has recently matched the peak seen at the height of the Dotcom Bubble.
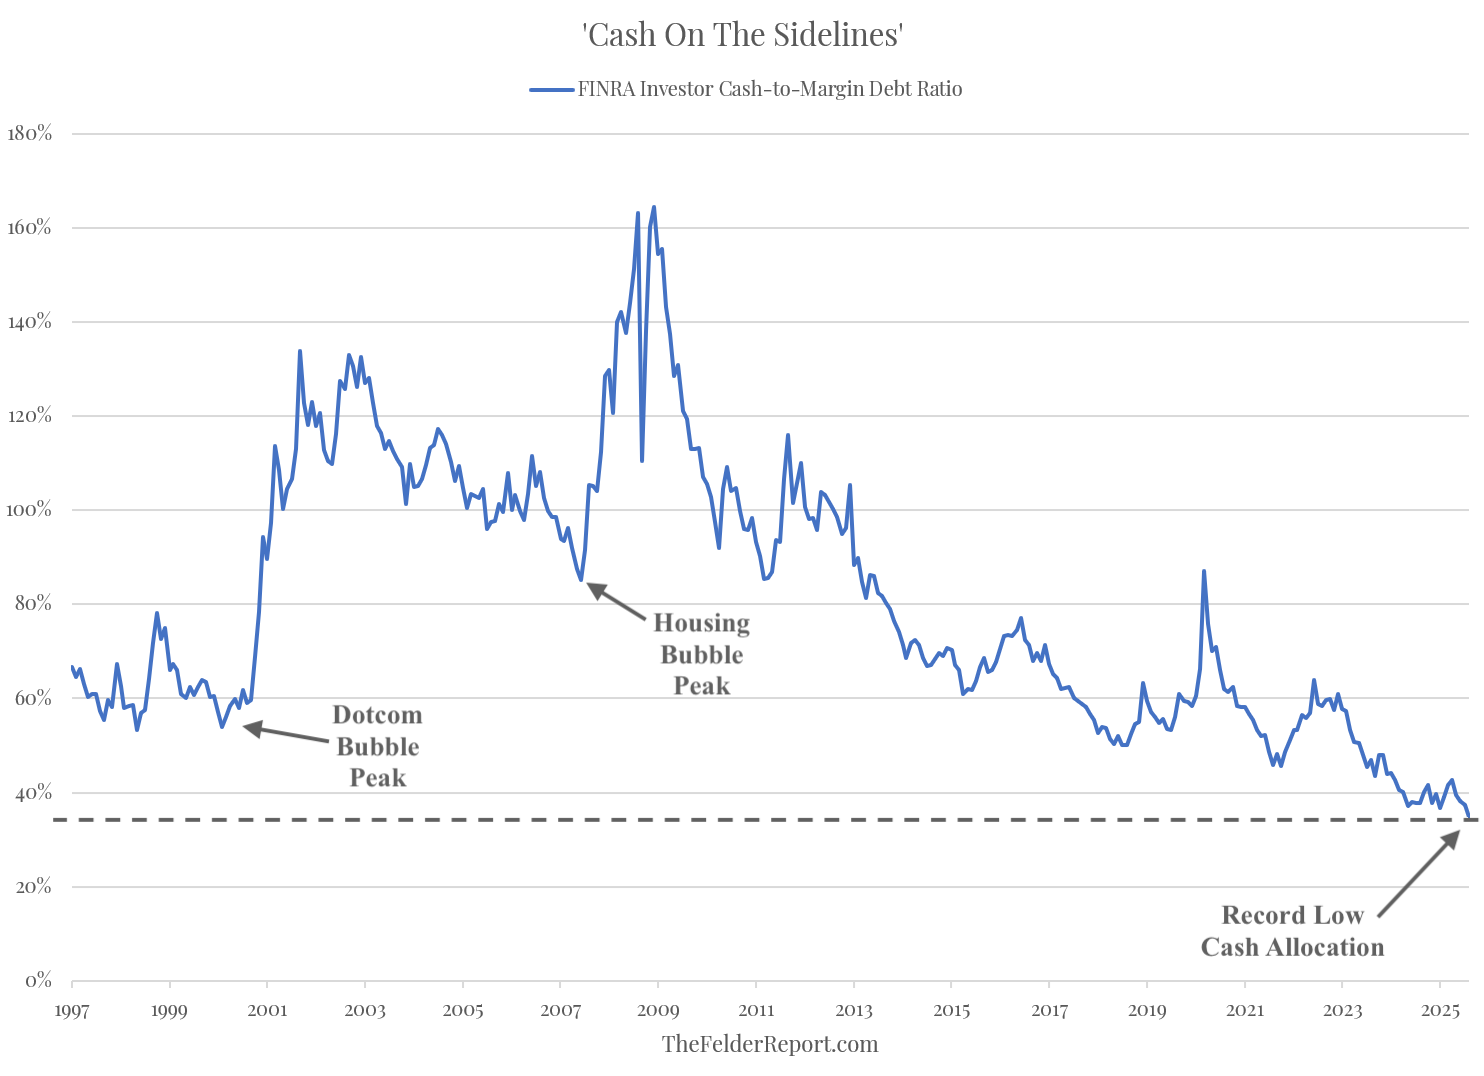
Finally, we can also compare the total level of margin debt to cash balances in the very same accounts. Looking at this ratio, it’s plain to see that investors, as a group, have never been more aggressive than they are today, carrying less cash relative to overall margin debt than any time since 1997 (when the cash data begins).
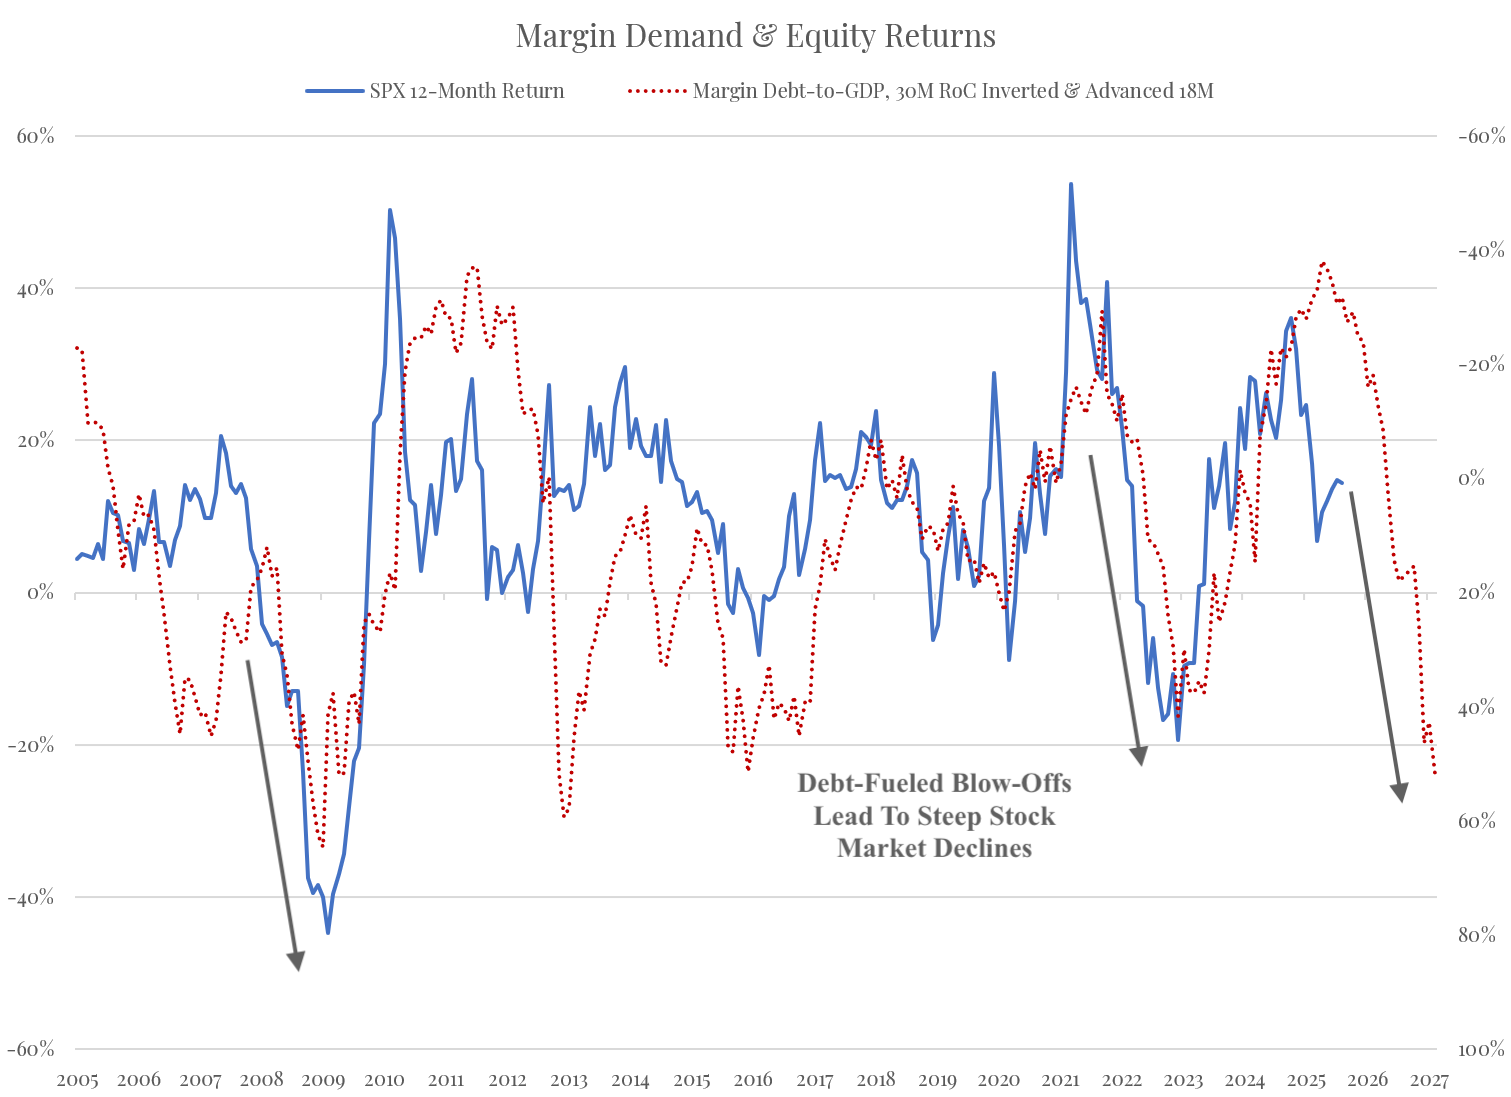
It also may be useful to look at the rate-of-change in the index of the volume of speculation (margin debt-to-GDP). Because, not only has the overall level reached “rarified air,” as noted above, the growth in that figure over the past 30 months has also been extreme. In the past, this sort of leveraged risk seeking behavior has ended in some steep stock market declines, notably in 2008 and 2022.
What makes this time unique, however, is that, on top of this leveraged risk seeking via margin debt, investors have also utilized leveraged ETFs and options in magnifying their upside exposure to degrees never seen before. And so these figures only capture part of the story which is even bigger than these already obscene figures indicate.
