A few years ago, I was studying the relationship between the major stock market indexes and their volatility indexes and I came across and an intriguing phenomenon. The vast majority of the time these indexes move in opposite directions from one another. If stock prices are rising, volatility indexes are usually falling and vice versa. It’s when this relationship inverts that things get interesting. And that’s exactly what happened again last week.
A new Nasdaq Volatility Correlation sell signal triggered last week when the 10-day correlation (the bottom panel in the chart below) of the NDX and VXN turned positive because both had risen together over that span. Previous sell signals are marked on the chart below by a vertical red line. Buy signals occur when the 10-day correlation turns positive because both the index and its volatility index are falling together. These are marked by vertical green lines in the chart.
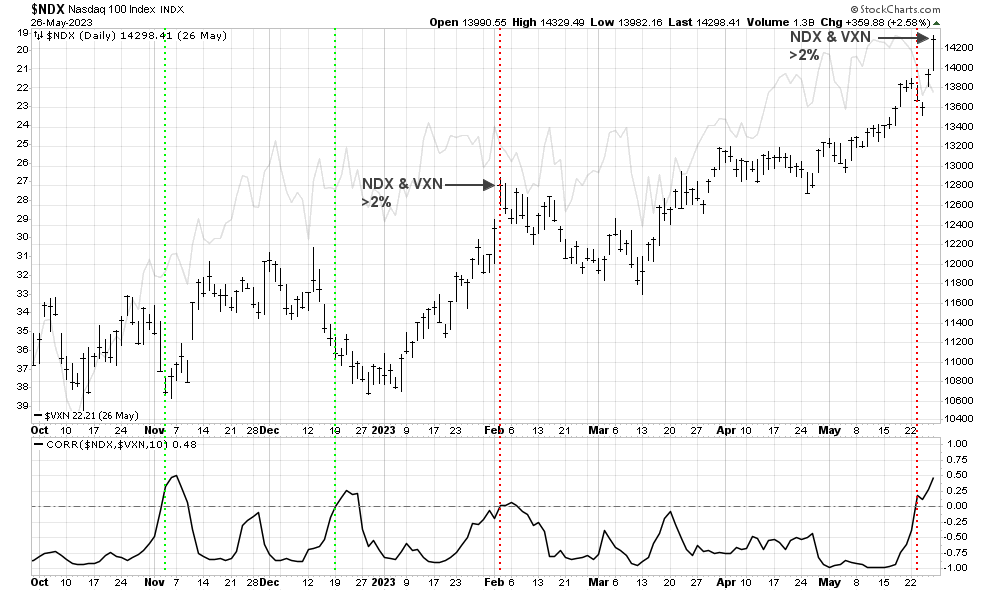
Why these signals are, at times, effective is anyone’s guess but it’s clear that disconnects like this between equities and options markets can be important signals of impending trend reversals. The two previous buy signals late last year proved to be effective in that regard. The last sell signal in early-February also proved effective as stocks struggled over the following month or so.
Time will tell if this most recent sell signal will also prove effective in this way. It’s interesting to note, however, that it also culminated in an even more rare signal on Friday when both the NDX and VXN rose more than 2% on the day (last seen on 2/2). This is a pretty strong indication that the options market is not nearly as sanguine as the equities market at this stage of the rally. And that in itself may be an important development to pay attention to.
Find this chart and many more like it in my free public chart list at StockCharts.com.