
It’s popular on Wall Street to say, “you can’t time the market.” However, just because most people are bad at it doesn’t mean the tools don’t exist to do it fairly well. In fact, there is one market timing tool in particular that long-term investors should pay close attention to and that is the Coppock Curve. My friend Tom McClellan of McClellan Financial Publications recently wrote about the origin of the indicator:
[Edwin S.] Coppock had been a money manager, and did some work managing assets for the Episcopal Church in the U.S. As part of that, he had a discussion with a priest about the grieving process, and the priest asserted that it takes a person 11 to 14 months to grieve over the loss of a loved one. Coppock concluded that the process of getting over a big loss on an investment might work the same way in terms of human psychology, and so he incorporated that timeframe into his indicator. What he wanted was a way to identify the really important long-term buying opportunities.
And this is really where the Coppock Curve (sometimes called the Coppock Guide) really shines, in helping long-term investors determine when it is an opportune time to get aggressive in the equity market. My friend Jim Stack of InvesTech Research recently wrote about its usefulness:
This indicator has a remarkable 100+ year track record when it comes to signaling the start of a new bull market for stocks. And it is one of the few technical tools that would have kept anxious investors from stepping prematurely into the middle of the 1929-1932 record stock market decline… Coppock Guide buy signals are marked by upturns from readings at or below zero. And often the more negative the reading when it turns upward, the more impressive the profits ahead. Using these guidelines has confirmed practically every major bull market run since 1920, with just two false signals given in 1941 and November 2001.
While it is true that timing stock market peaks may be more difficult, once a bear market has begun, investors using the Coppock Curve at almost any point in time over the past century would have largely been successful in timing major stock market bottoms.
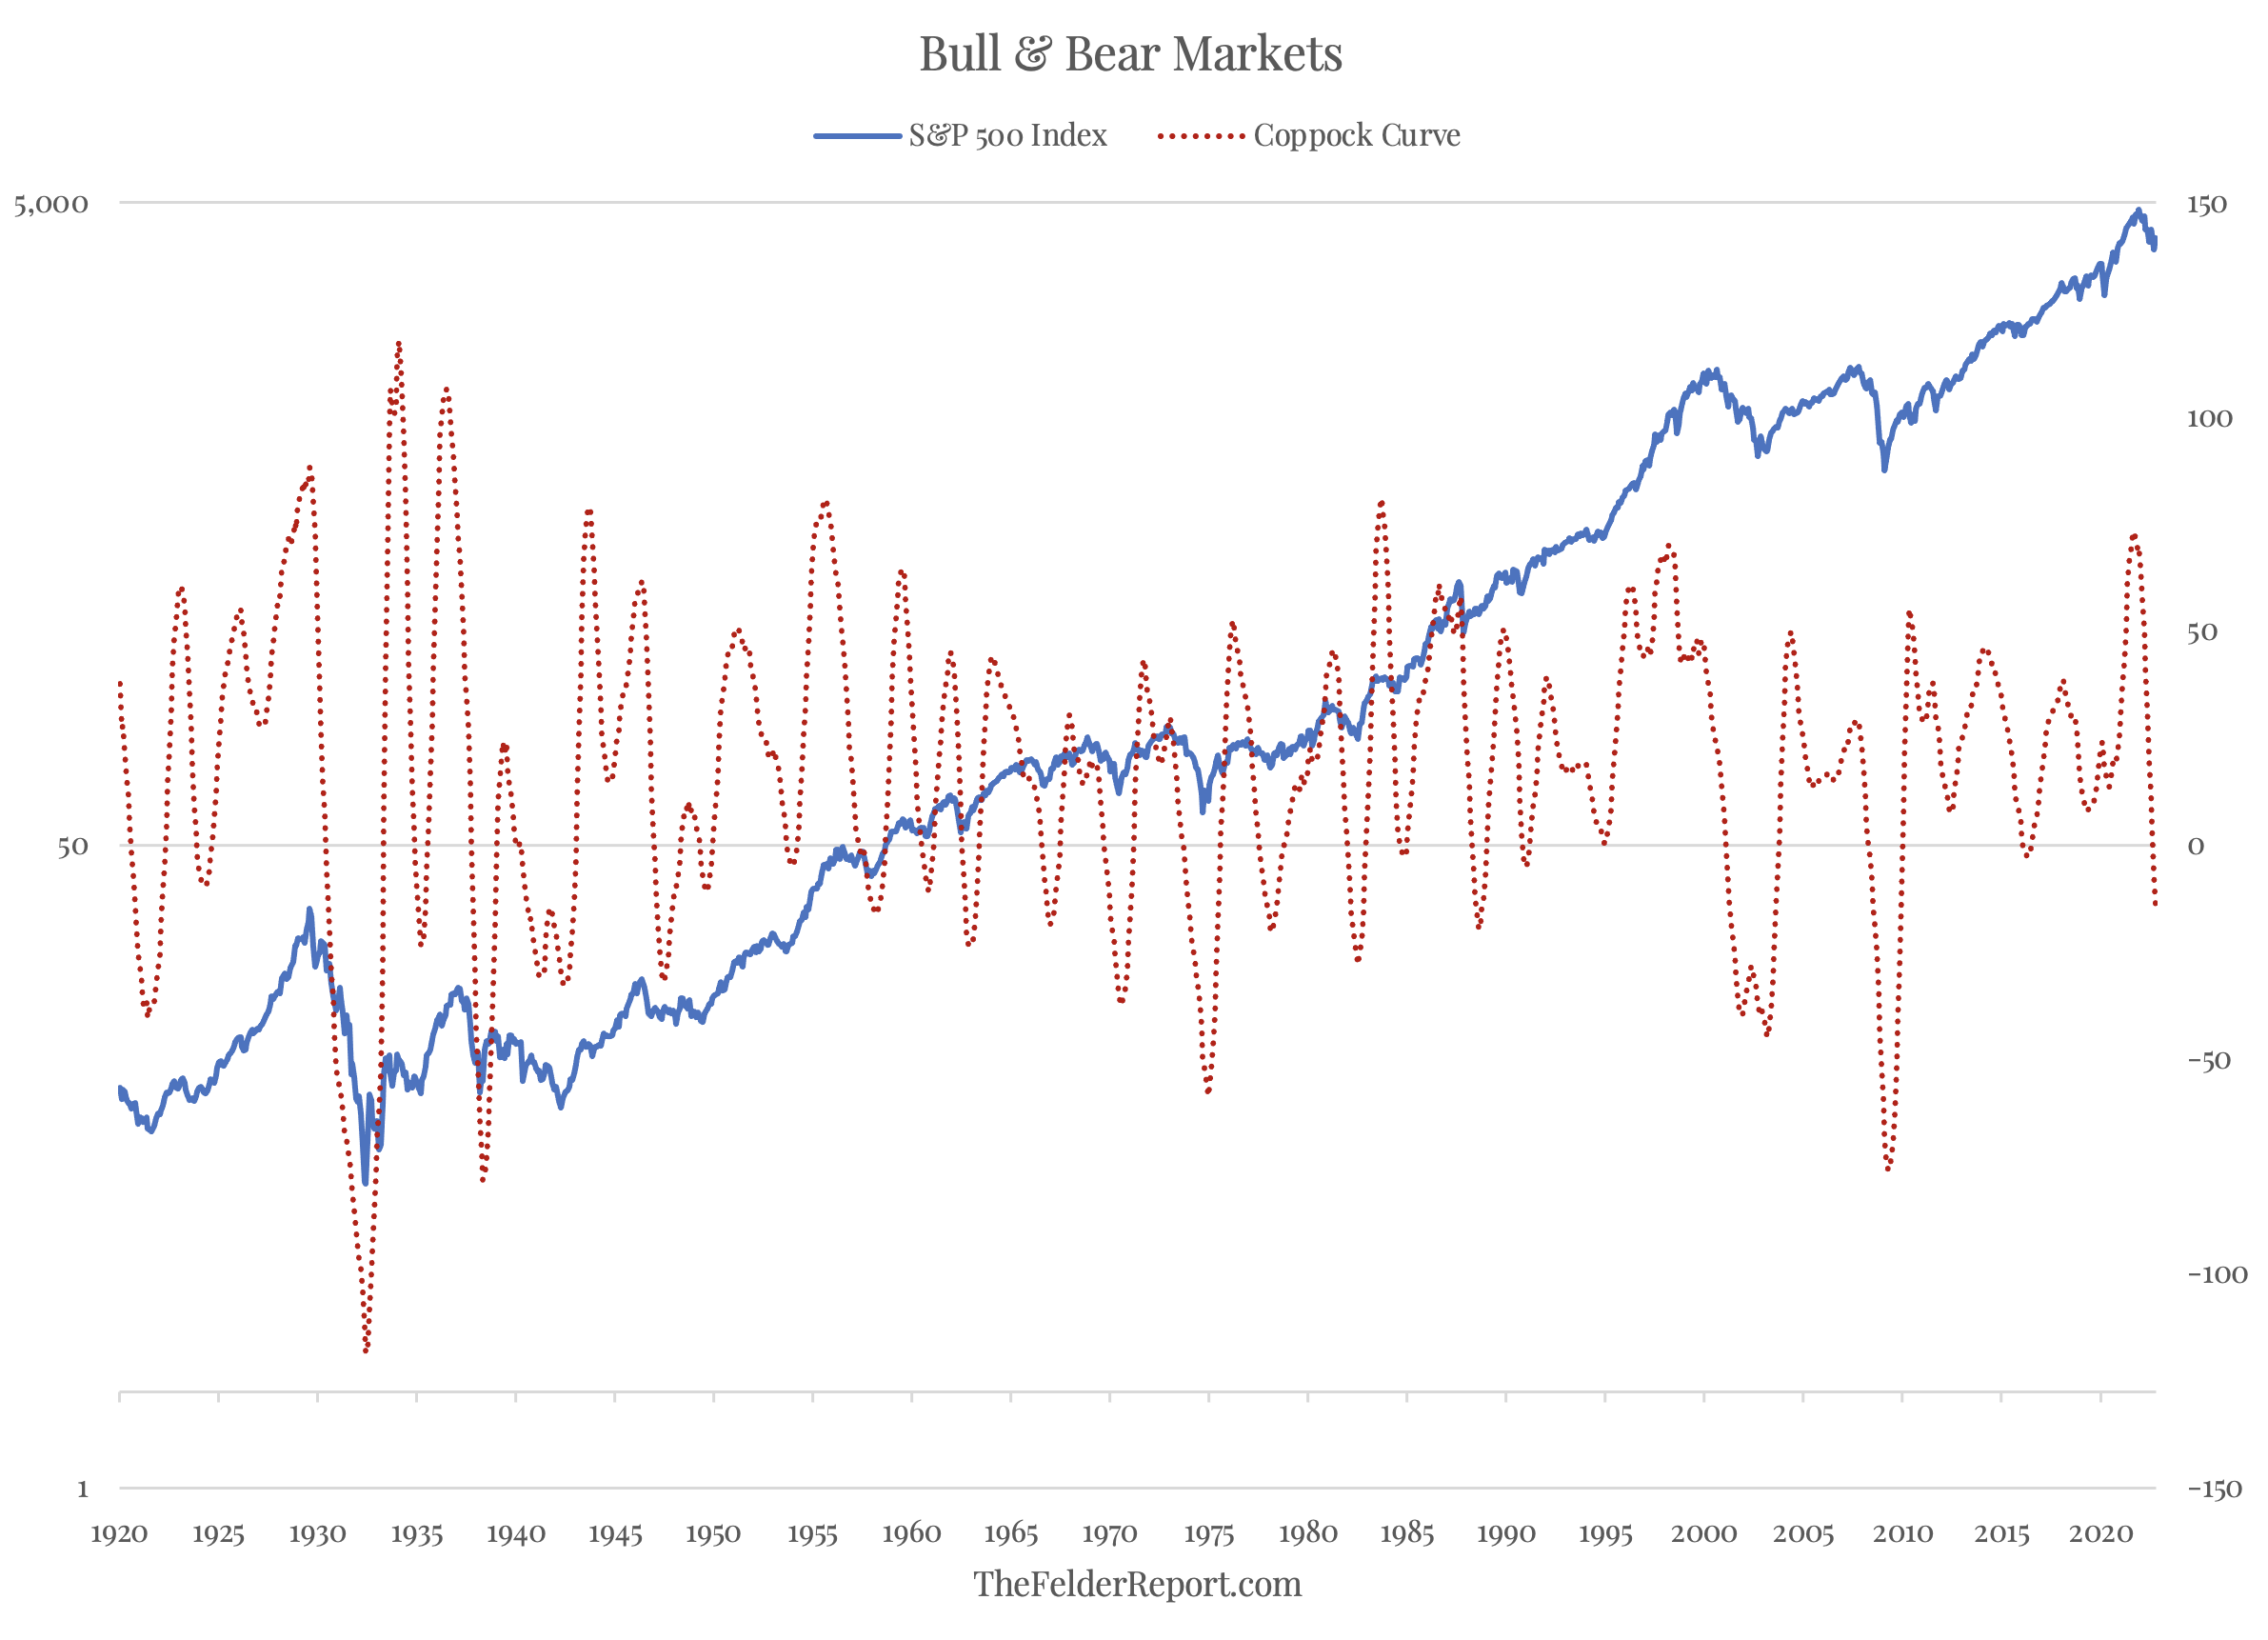
For this reason, it is noteworthy that the Coppock Curve broke below the zero line back in September. Moreover, it is unlikely to form a bottom and curl higher for at least a few more months. Even if the current rally were to continue higher the Coppock Curve likely wouldn’t itself reverse higher before February. And if the rally rolls over once again, it will push the upturn in the indicator out even further. In short, the grieving process for Mr. Market (over the loss of massive monetary stimulus) may take a bit longer than bullish investors today might hope.
So the next time you hear someone say, “you can’t time the market,” perhaps you should think to yourself, “maybe YOU can’t time the market but I know a tool that is pretty good at it.” Because, at the end of the day, everything is forecast. Rather than pretending otherwise, it probably makes sense to utilize a tool like the Coppock Curve to improve your own forecasting ability.