“Even the most circumspect friend of the market would concede that the volume of brokers’ loans—of loans collateraled by the securities purchased on margin—is a good index of the volume of speculation.” -John Kenneth Galbraith, The Great Crash 1929
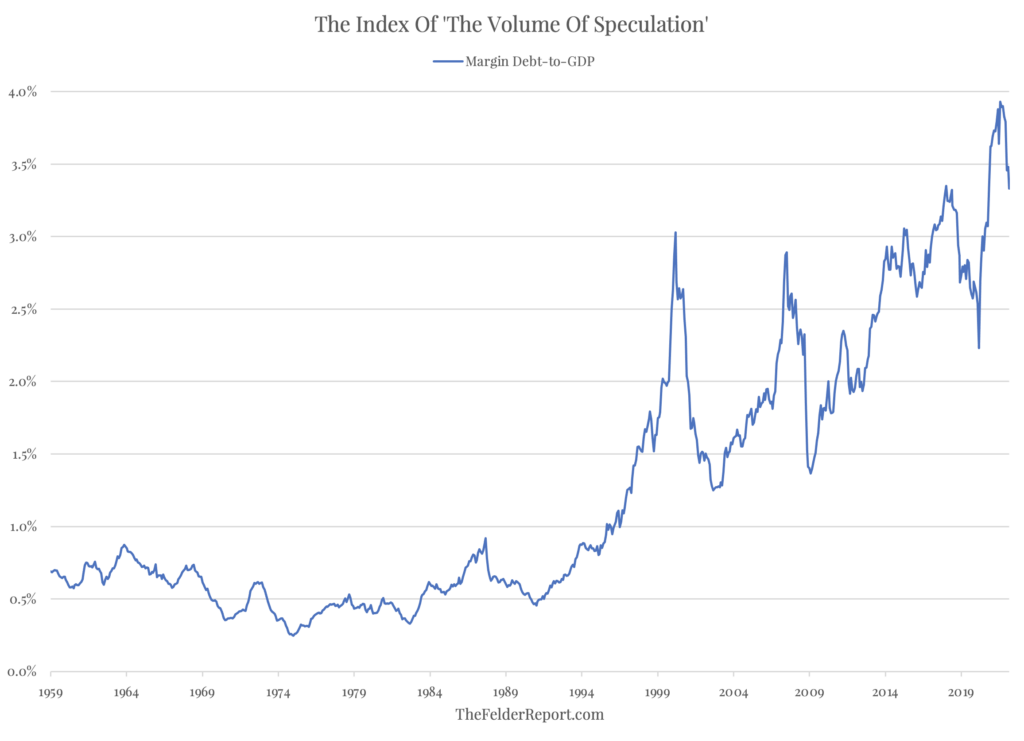
About a year ago, I noted that the “Index of the Volume of Speculation,” also known as margin debt, was in the process of putting in a blowoff top. The absolute level had reached record highs, suggesting that we were witnessing a degree of speculative activity that surpassed anything since the late-1920’s stock market mania Galbraith was specifically referring to in the quote above.
What’s more, it’s important to note that margin debt may be merely representative of a much larger use of leverage in things like asset-backed loans, call options, futures, leveraged ETFs, total return swaps, etc. All told, the total amount of leverage employed in the markets for risk assets may, in fact, be even larger than that earlier, ominous precedent.
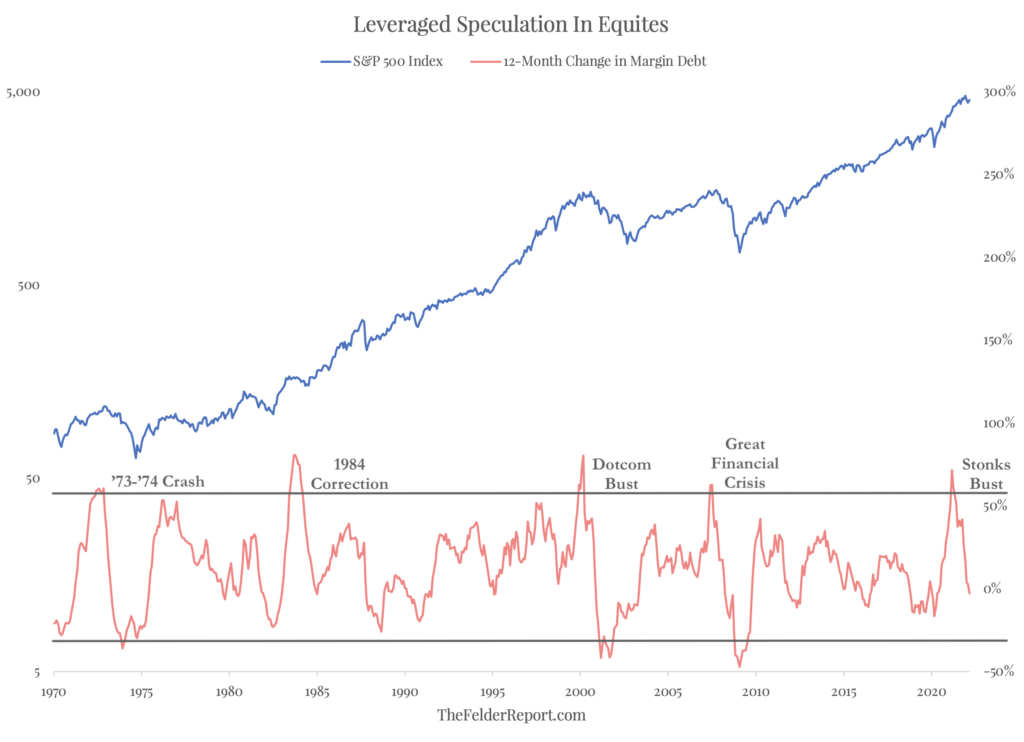
 The recent peak in the annual rate-of-change in the amount of margin debt outstanding, however, was not unprecedented. In fact, we’ve seen several episodes in the past in which investors embraced leverage in a similarly enthusiastic way. All but one ended in a major bear market. (The reason 1984 likely didn’t is that leverage even in relative terms was 80% below today’s peak and the S&P 500 Index sported a price-to-earnings ratio of just 10 at the time versus its more recent 30).
As both charts demonstrate, the process of leveraging up has reversed and deleveraging is now underway. And it’s this deleveraging process that is likely responsible, to some degree or another, for the steep stock market declines that normally follow the blow off tops in these episodes. And from the looks of both charts, we haven’t yet come close to a level of deleveraging that indicates the worst is now behind us.


