 One thing I try to do with this podcast, is to find people who are taking a truly unique approach to analyzing the markets, those taking the “financial road less traveled,” as I like to call it. Well, Michael Oliver is surely one of those. There is traditional technical analysis, the study of charts which has been around for as long as markets, and then there is Michael’s, “momentum structural analysis,” which is an entirely original way of studying price patterns and trends. It was almost exactly two years ago, I first got the chance to interview Michael about his methods. In this conversation (recorded in Fort Collins, Colorado), Michael goes into even more depth about his analytical techniques and what they are saying about the markets today.
- Follow Oliver MSA on Twitter: @Oliver_MSA
- Check out Michael’s website: OliverMSA.com
- Listen to Michael’s earlier interview: Michael Oliver On Why Momentum Is Truth In Markets
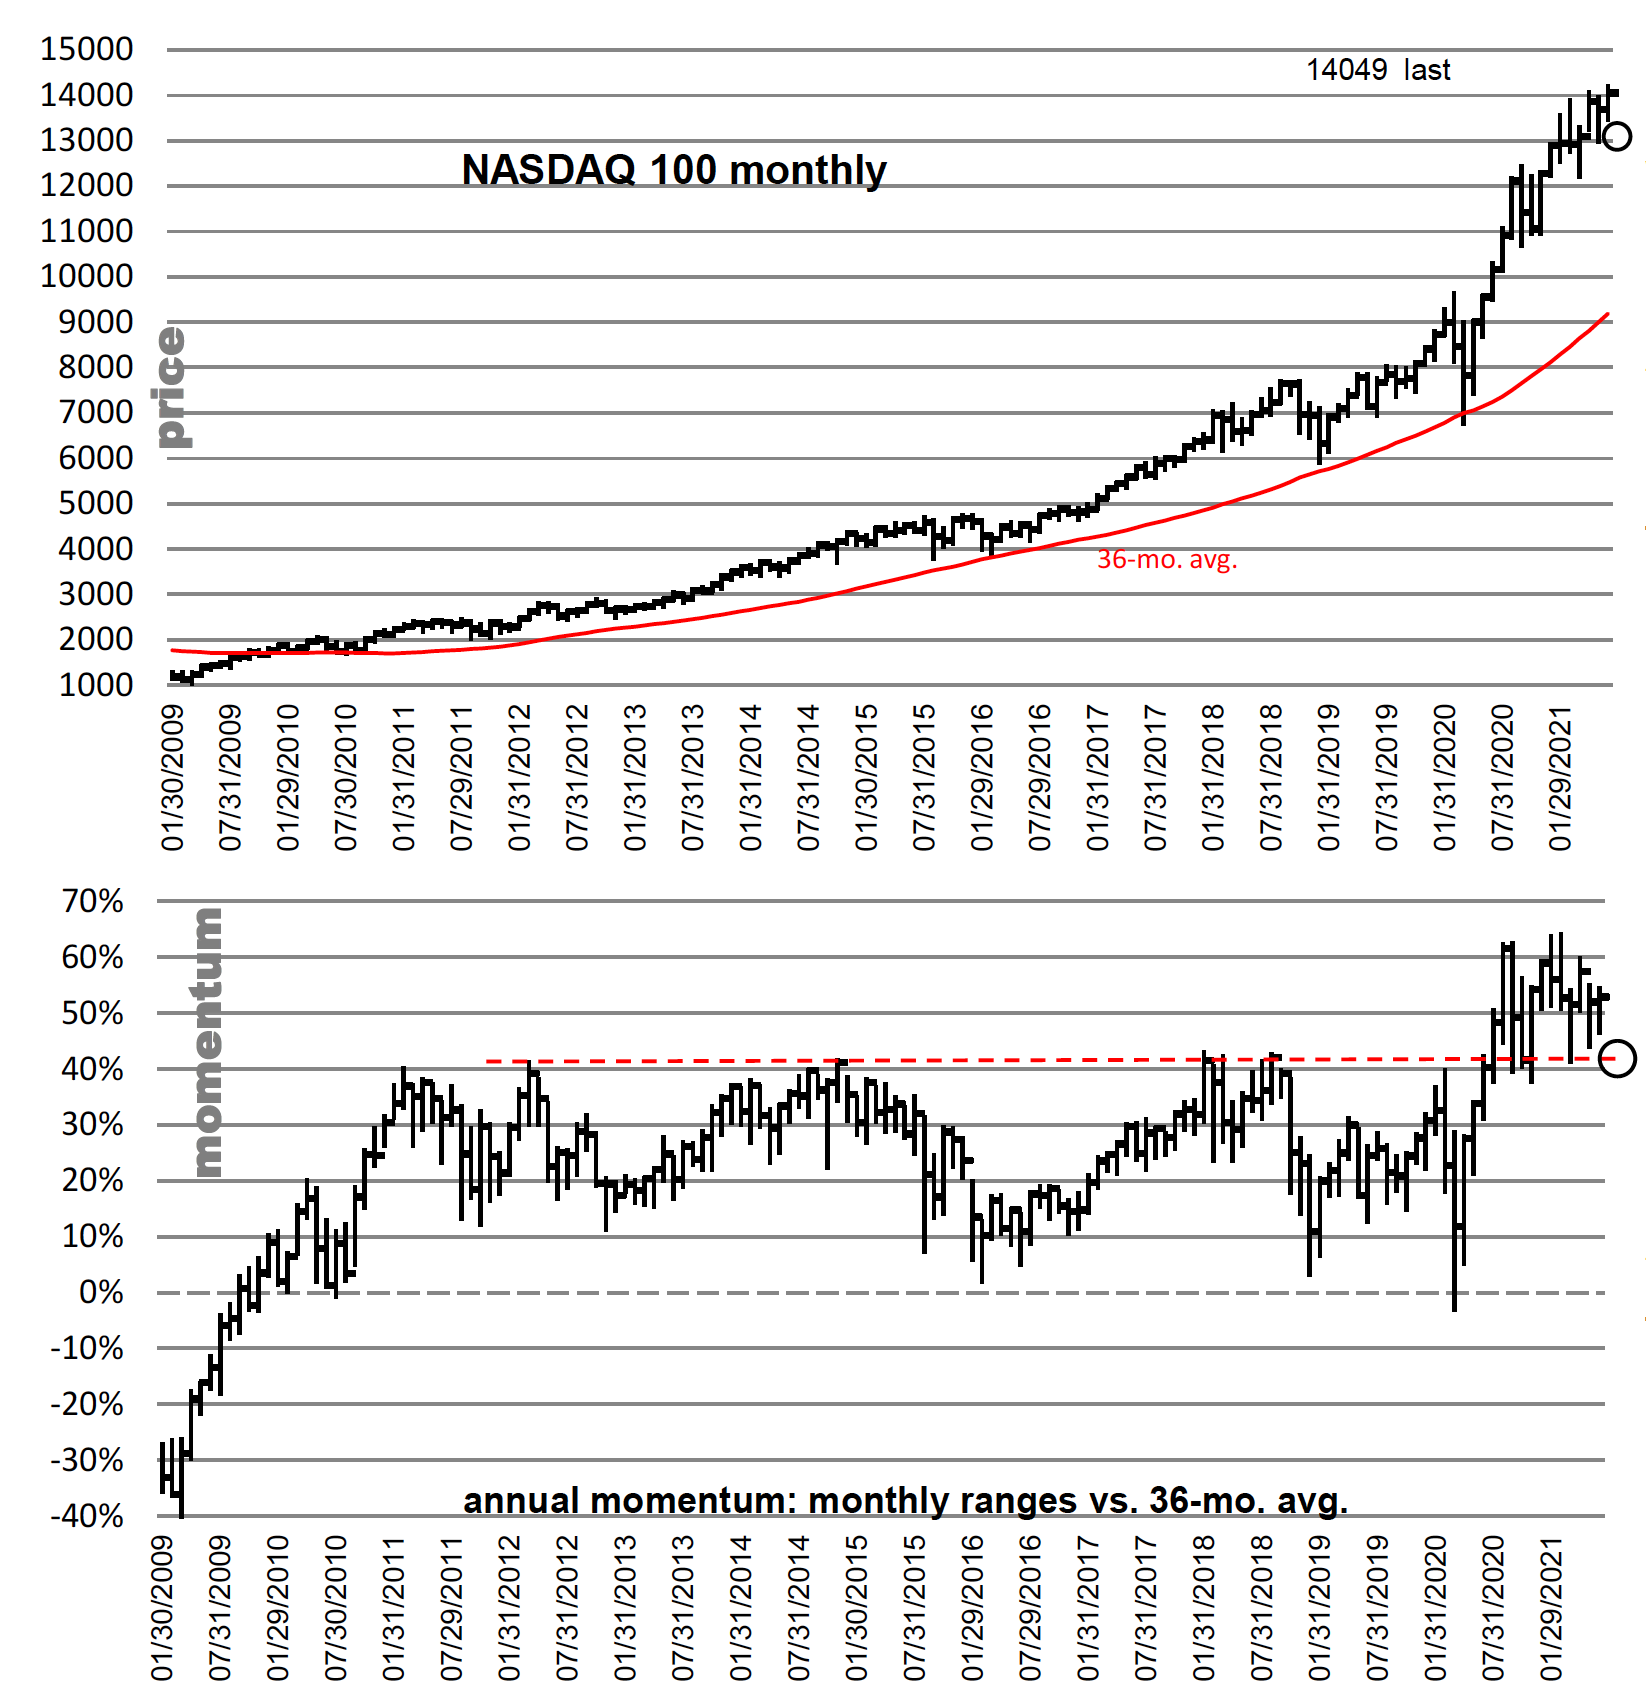
MSA’s 36-month momentum chart of the Nasdaq 100: “It’s rare to get such a massive and clear momentum structure developed, in this case the red horizontal on the bottom chart. It traces back to 2012. A violation of that in-your-face structure (which will not be evident on price) would open the door wide for a drop to the next key level around zero line/36-mo. avg. A disaster in itself just getting to there, and we wouldn’t bet on that overused zero line area holding if approached again.”