We’ve just entered the heart of earnings season and it’s during this time I typically like to take a look at a wide variety of stocks and how their valuations compare with their fundamentals. One of my favorite ways to do this is to simply compare a stock’s price-to-sales metric with its sales growth over time. Usually there is a pretty tight correlation, at least with the most popular growth names in the market.
However, there are times when these two diverge and this is a pretty good indicator of what investors expect from sales performance going forward. When the price-to-sales ratio jumps ahead of sales growth, investors are optimistic and vice versa.
With the stock market rallying strongly over the past month in the face of deteriorating fundamentals, it’s clear investors are beginning to expect brighter days ahead. Nowhere is that more true than in the case of the FANG stocks.
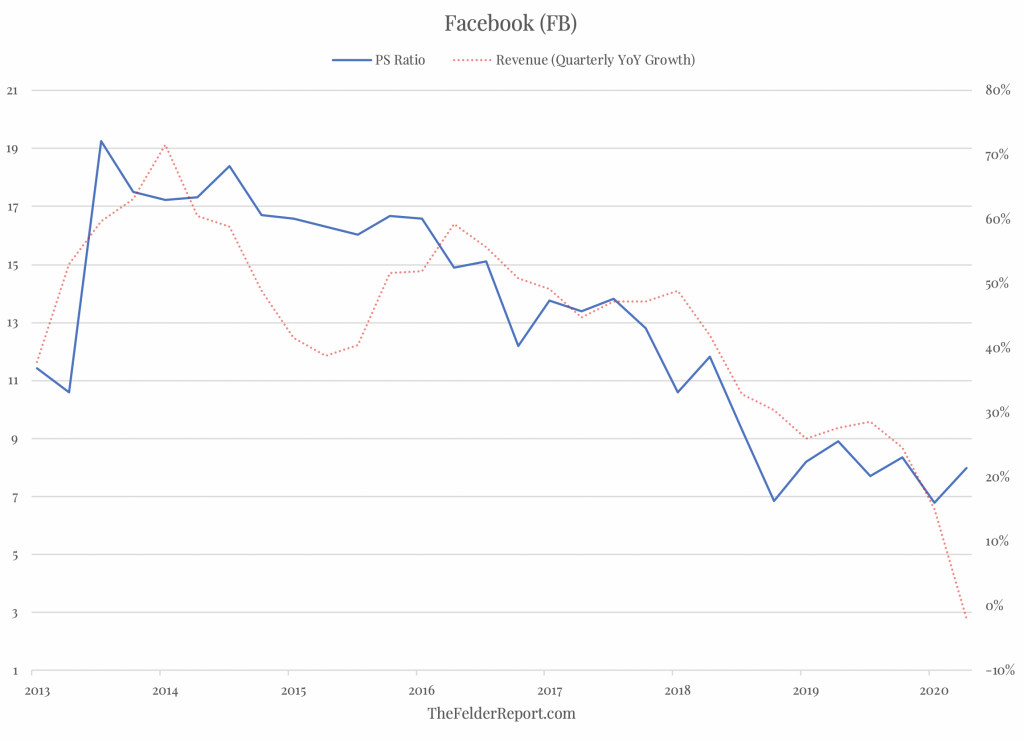
Starting with Facebook, the relationship between the price-to-sales ratio and the company’s revenue growth should be obvious with just a glance at the chart below. Yet with sales expected to drop into negative territory, investors have pushed up the multiple of those sales leaving a widening gap.
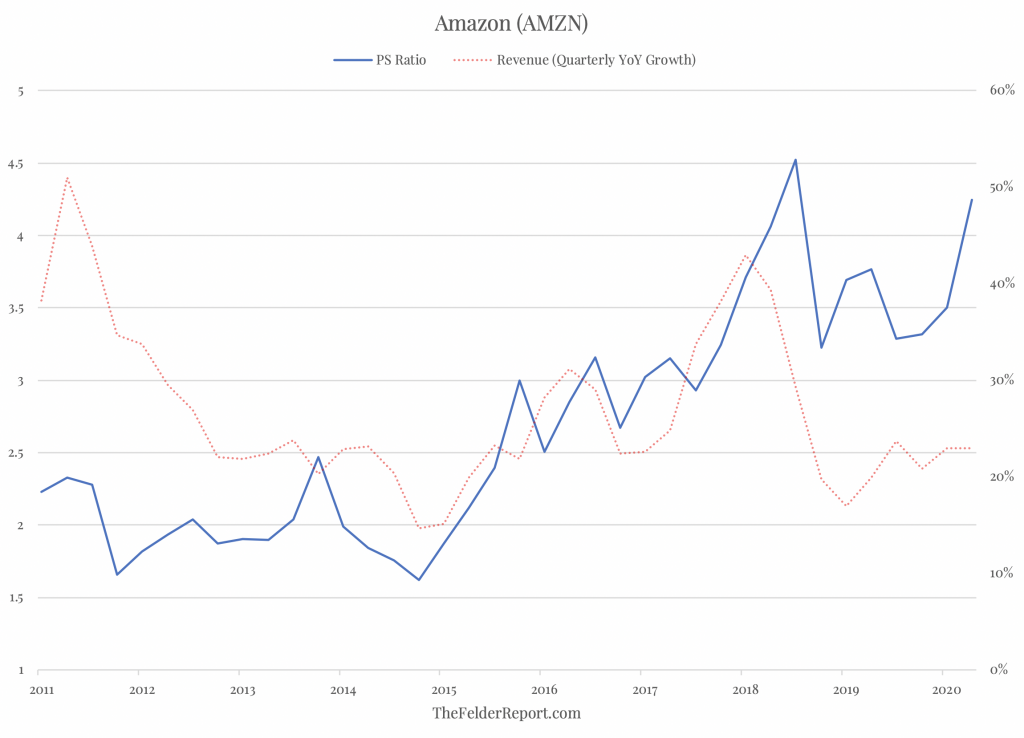
Amazon is a little different story as sales are expected to hold up well relative to most other companies during this pandemic. Still, the valuation seems to be discounting a doubling of revenue growth going forward, quite a herculean assumption.
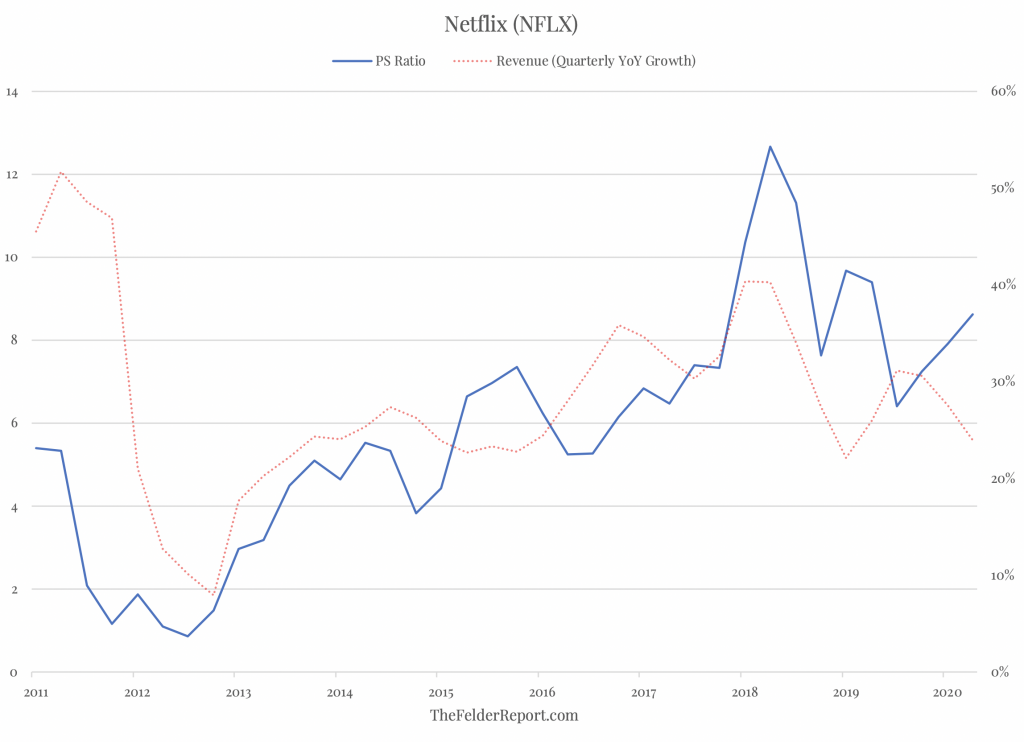
Netflix, like Amazon, seems to be fairing very well during this time and also for obvious reasons. But here again investors seem to be extrapolating its recent sales gains well into the future.
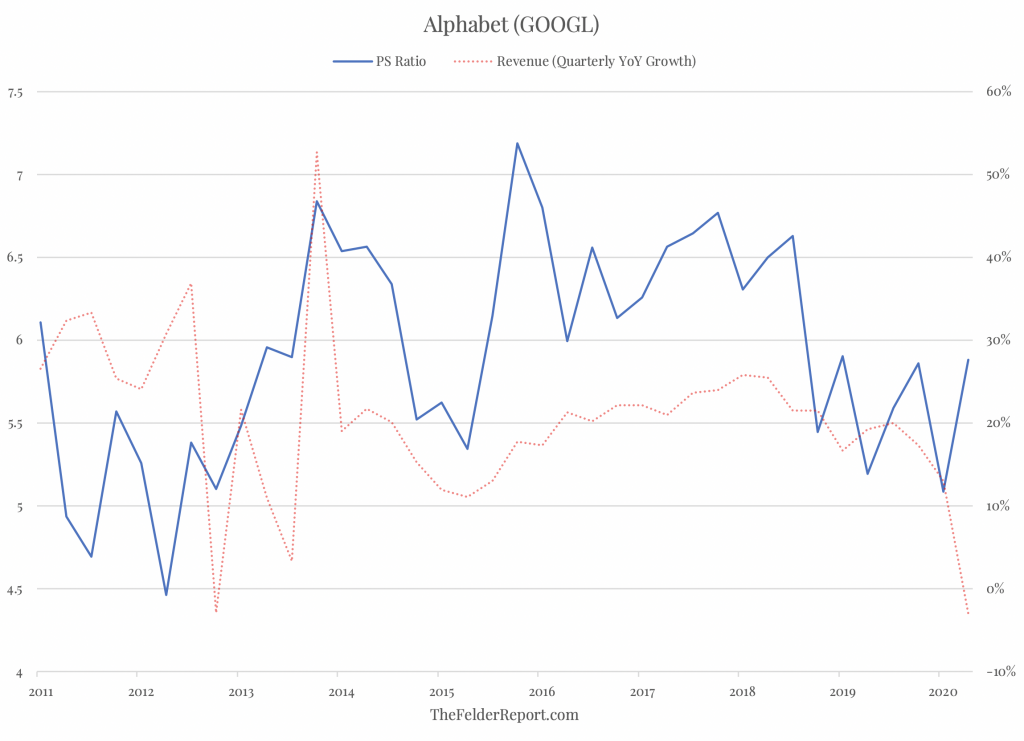
Finally, Alphabet (formerly known as Google), just reported financial results that investors saw fit to celebrate. Even though it is expected to see sales growth turn negative next quarter, its multiple of those sales is hitting a new 1-year high today.
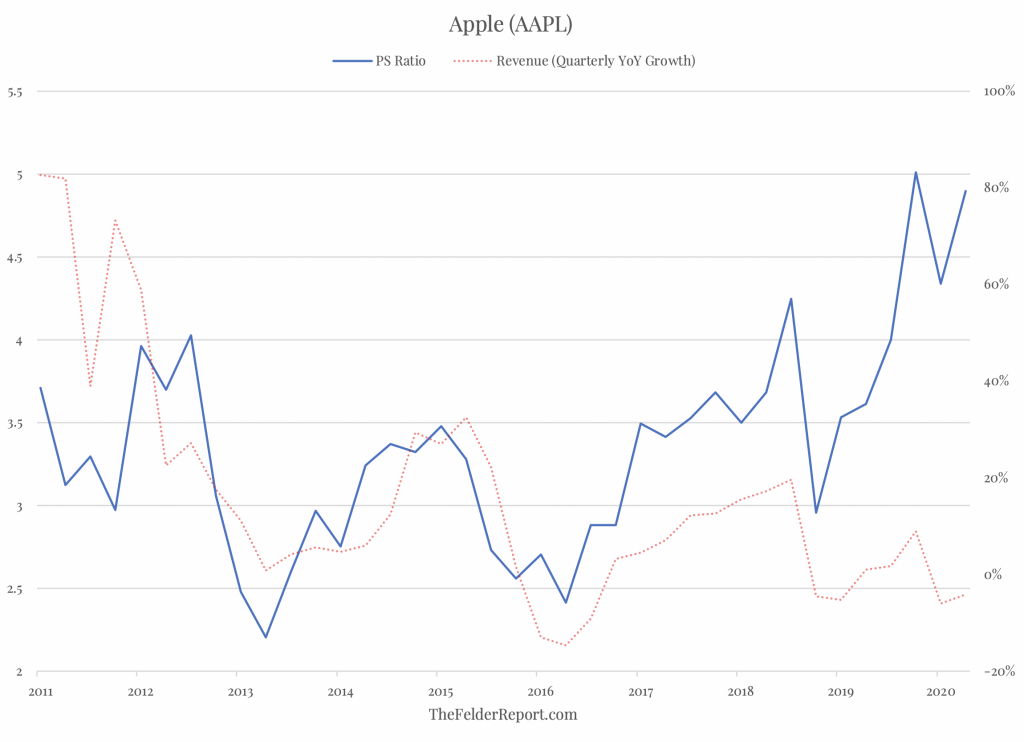
We can also add a couple of other popular stocks to the list, expanding FANG to FANMAG, as some have been wont to do. Looking at Apple, over the past year or so this stock has completely parted ways with its fundamentals. The stock trades at its highest valuation amid its lowest sales growth of the past decade (a far cry from the incredible value it offered in 2013).
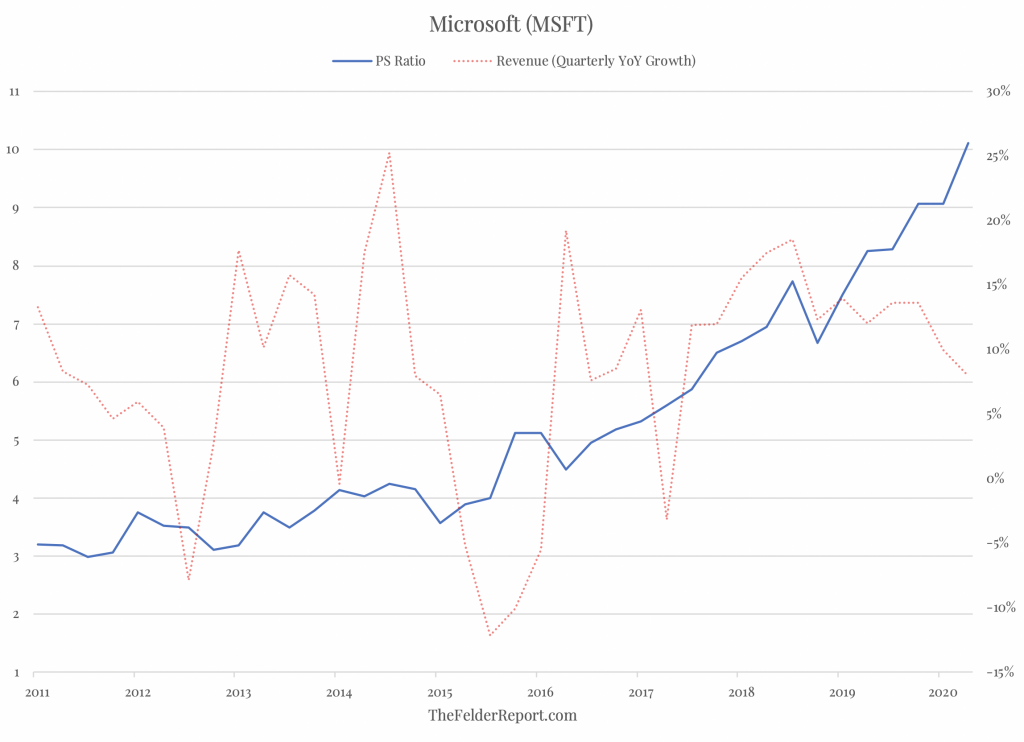
Even more dramatically has Microsoft seen its valuation triple even as sales have remained range bound. There seems to be almost no relationship here, whatsoever.
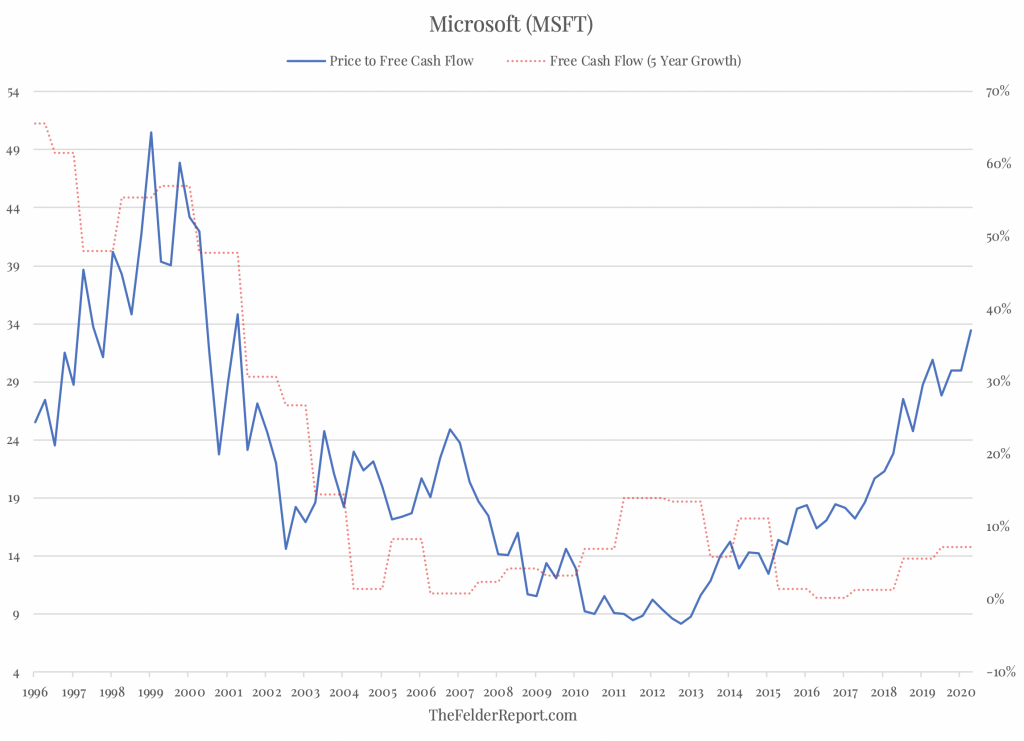
Using a different metric, though, and taking a longer-term time frame we can start to see that Microsoft has traded at a price-to-free cash flow ratio closely in line with its long-term free cash flow growth. That is, until recently. Microsoft trades today at the same valuation it did in the summer of 2001, when its long-term free cash flow growth rate was more than 4-times greater than it is today.
In all of these stocks, there is some form of optimism embedded into the price. In some cases, like Apple and Microsoft, this simply has to do with their long-term assumptions about the company’s ability to grow sales or cash flow. In others, like Netflix and Amazon, it has more to do with investors extrapolating their recent situational successes as a product of the pandemic.
In every case, though, it seems investors are happy to assume the pandemic is nothing more than a speed bump and that sales and earnings growth will soon get back to normal. (Normal being what we have seen over the past decade, never mind the improbability of compounding at these growth rates forever). The yawning gaps between valuations and fundamentals are a visual testament to this.
During a prolonged bear market precipitated by recession, these sorts of valuation anomalies simply don’t survive. So, either what we have witnessed so far this year is simply another dip to be bought and business will soon return to normal, or it won’t and valuations will catch down with fundamentals. And, considering just how wide some of these gaps have become, this could make the March decline look tame. Time will tell.


