I have written about the value of the Hindenburg Omen as a technical stock market signal several times over the past few years. To summarize, while an individual signal has very little value in forecasting a stock market crash, as some seem to suggest, a cluster of signals can be valuable in that it signals a pattern of dispersion that is not compatible with a healthy uptrend.
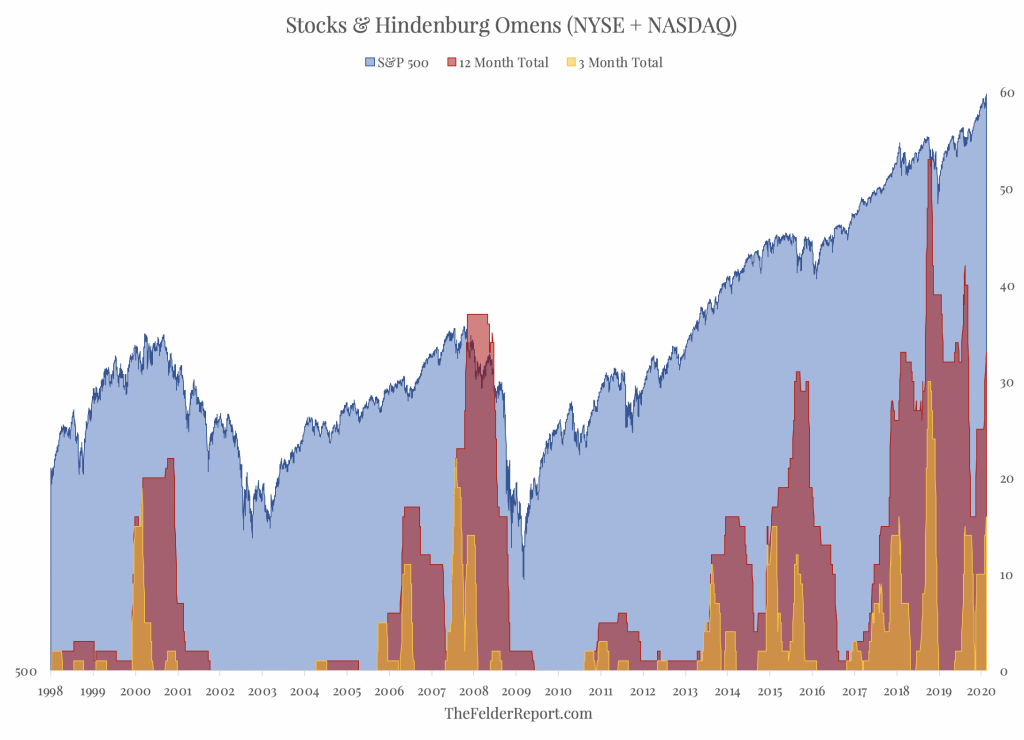
In the past, these clusters have marked important intermediate and long-term reversals. You’ll notice in the chart below that at both the 2000 and 2007 stock market peaks there were a significant number of omens triggered during both a 3-month and 12-month window. We saw something similar in mid-2015 before a pair of sharp corrections. We saw another rising pattern in early-2018 leading into the “volmageddon” selloff and again later that year just prior to the steep fourth quarter decline in the broad stock market.
Over the past couple of weeks, we have seen another cluster of 8 individual signals between the NYSE and Nasdaq. This takes the 3-month total back up to 16 and the 12-month total back up to 33, levels which have proved significant over the past twenty years or so. Again, this doesn’t mean stocks are going to crash; it merely suggests the current uptrend for stocks is not as healthy as the bulls should hope. Furthermore, it does increase the probability of near-term reversal for the broad indexes.


