This is based on an excerpt from a recent chart book featured on The Felder Report PRO.
One chart I’ve been watching for the past few years is the ratio of Gold to the S&P 500. Over the last half-century there have been good times to own gold and good times to own stocks and the two have rarely coincided (making gold a better portfolio diversifier than many alternatives). The trend in the ratio of the two (at the bottom of the chart below) has been a decent guide to understanding when to own each.
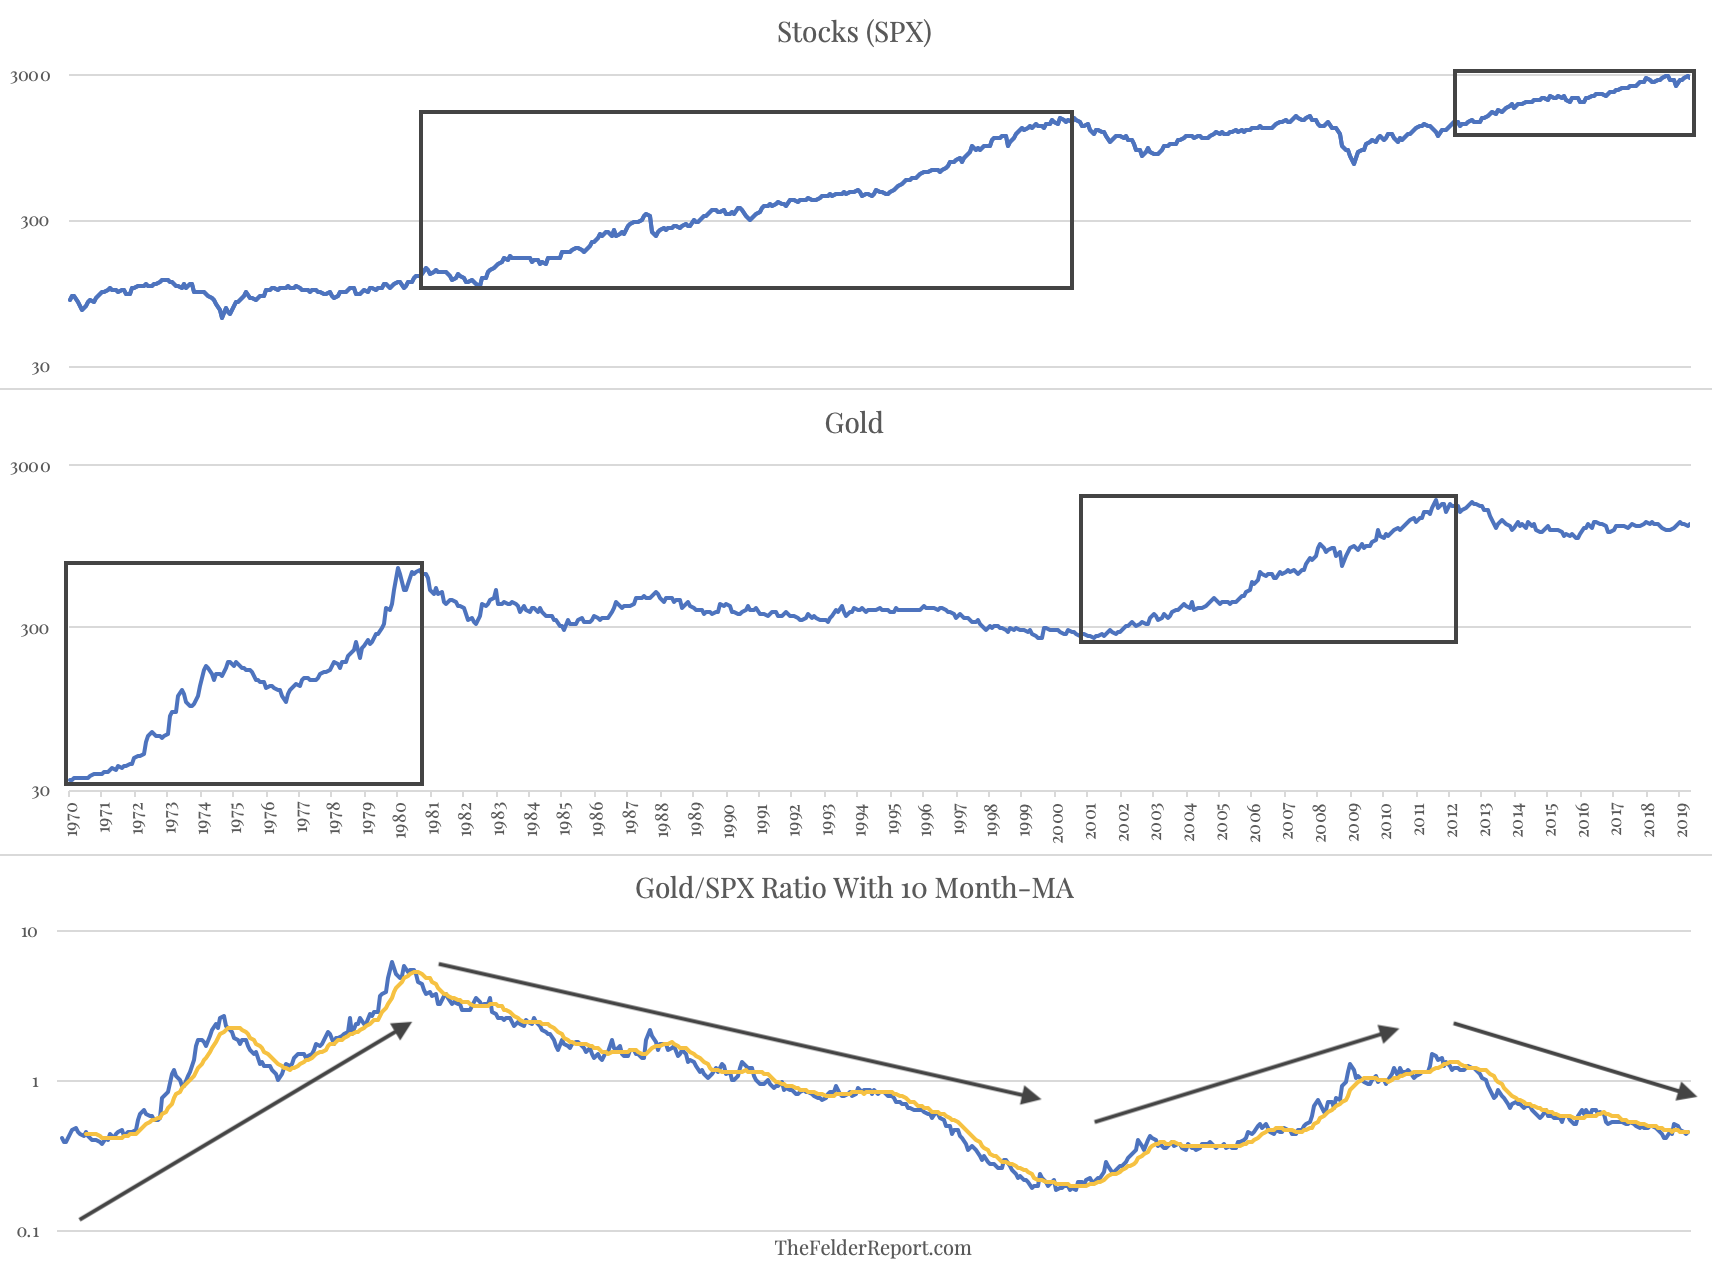
The ratio very recently crossed above its 10-month moving average thus giving another buy signal which would suggest market trends are supportive of owning gold versus owning stocks. Overcoming its most recent high set late last year would likely confirm this latest signal is more than just a “whipsaw.” And it would have important long-term implications for investors of all sorts as these trends have typically lasted a decade or longer.