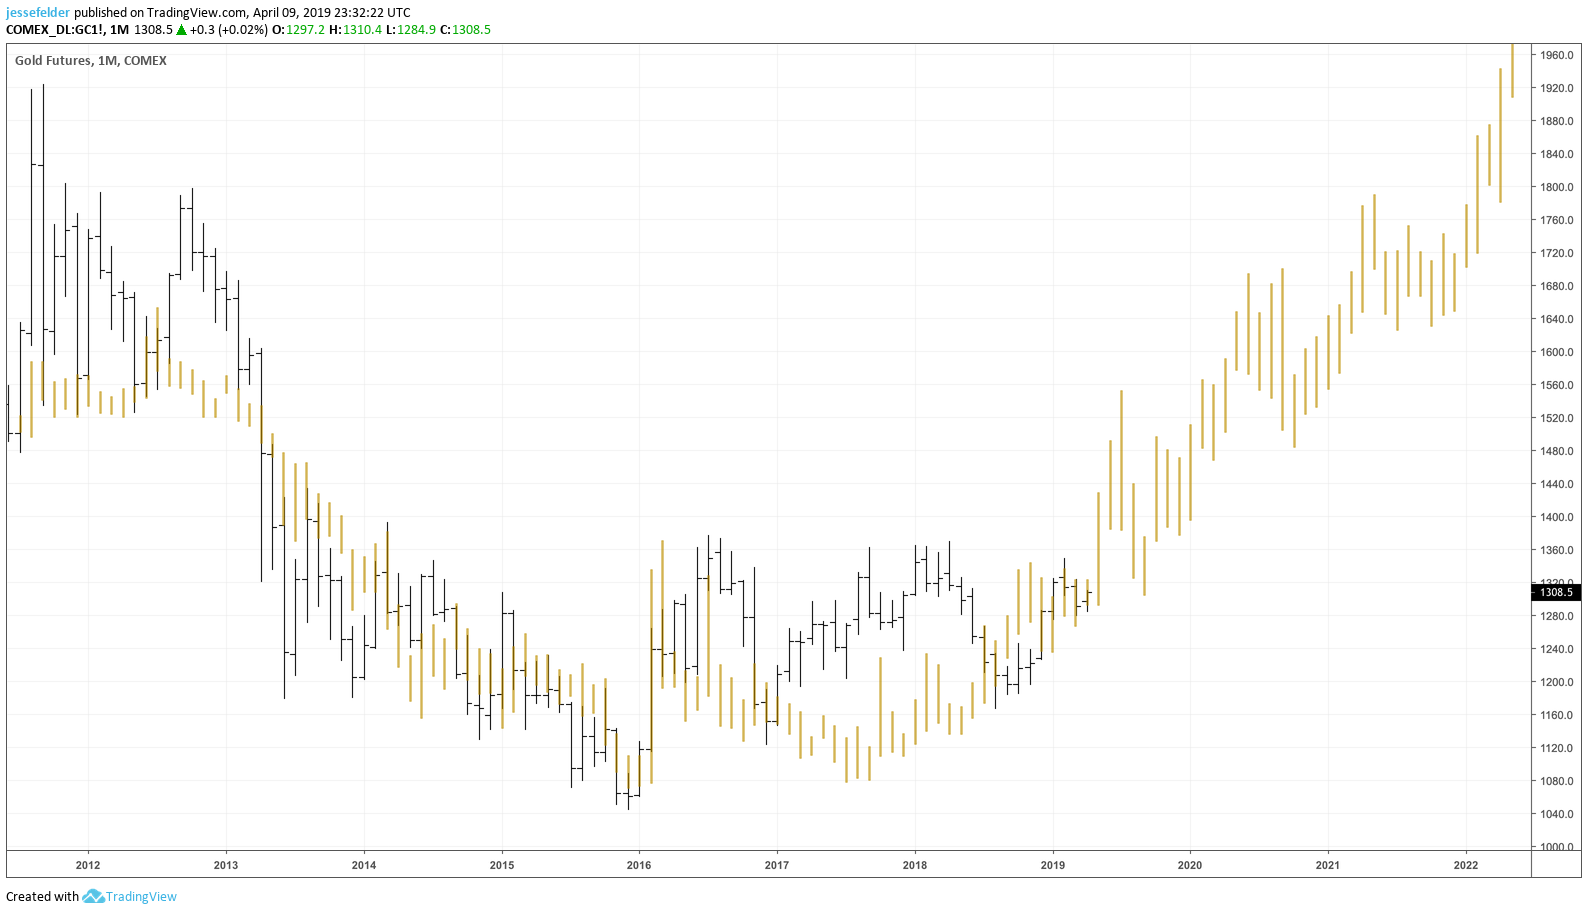
It’s been impressive to watch the gold price rally even in the face of a relatively strong dollar over the past six months or so. It’s also been interesting to see gold hedgers maintain a relatively bullish position in the metal even through the recent strength. This is a notable change from what we have seen over the past several years since gold bottomed in late-2015. During past rallies they have consistently taken down exposure. Not this time.
Similarly, gold sentiment has remained subdued during the recent rally. This may be just the sort of sentiment cocktail, bullish smart money and bearish dumb money, that allows for the precious metal to finally breakout above resistance at $1,350.
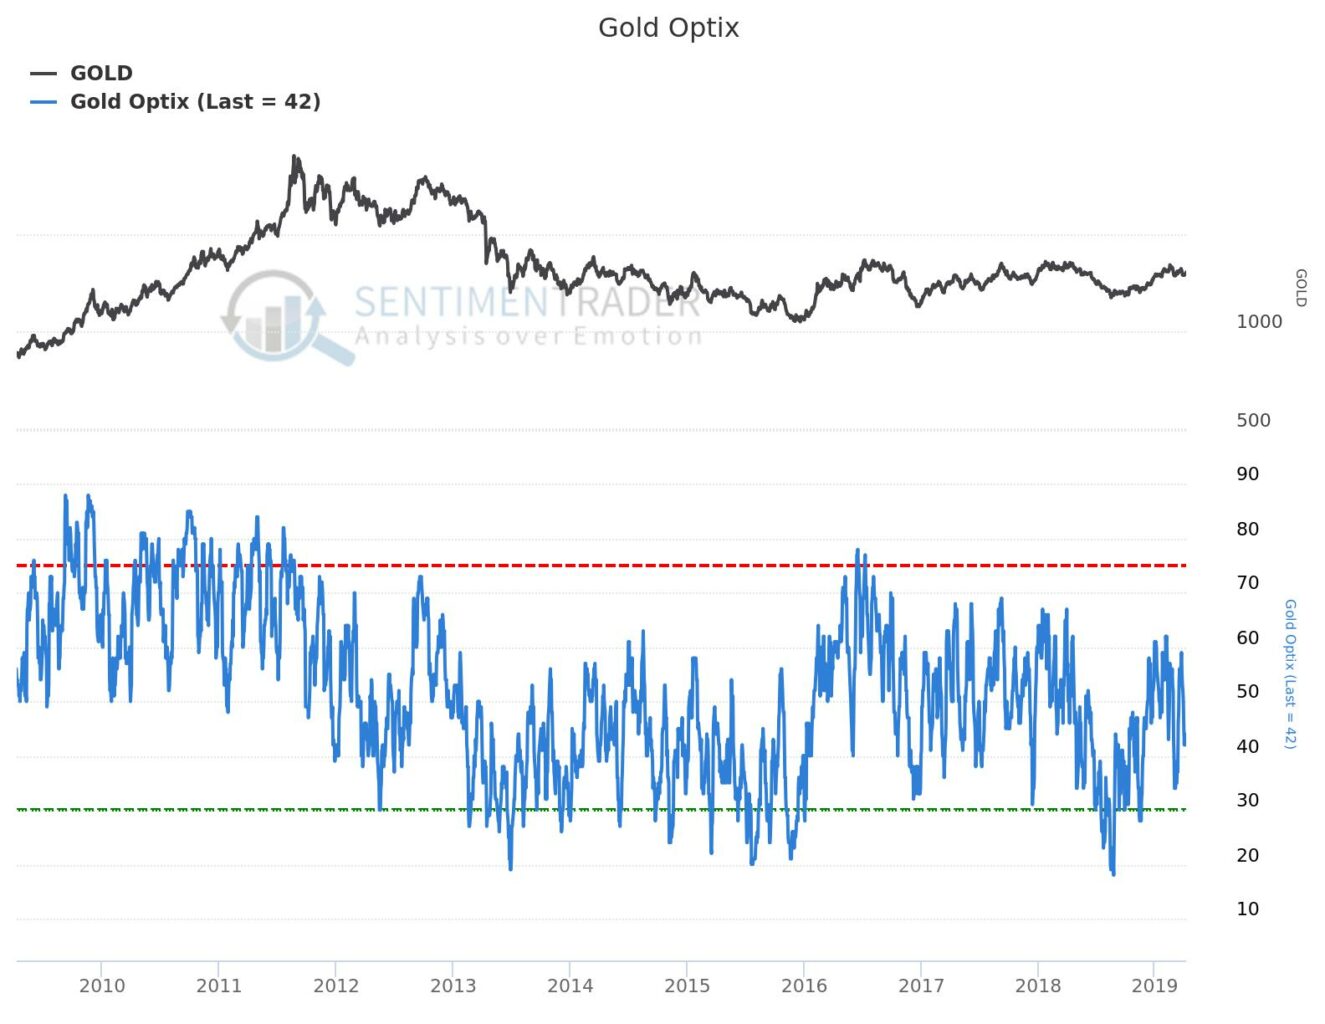
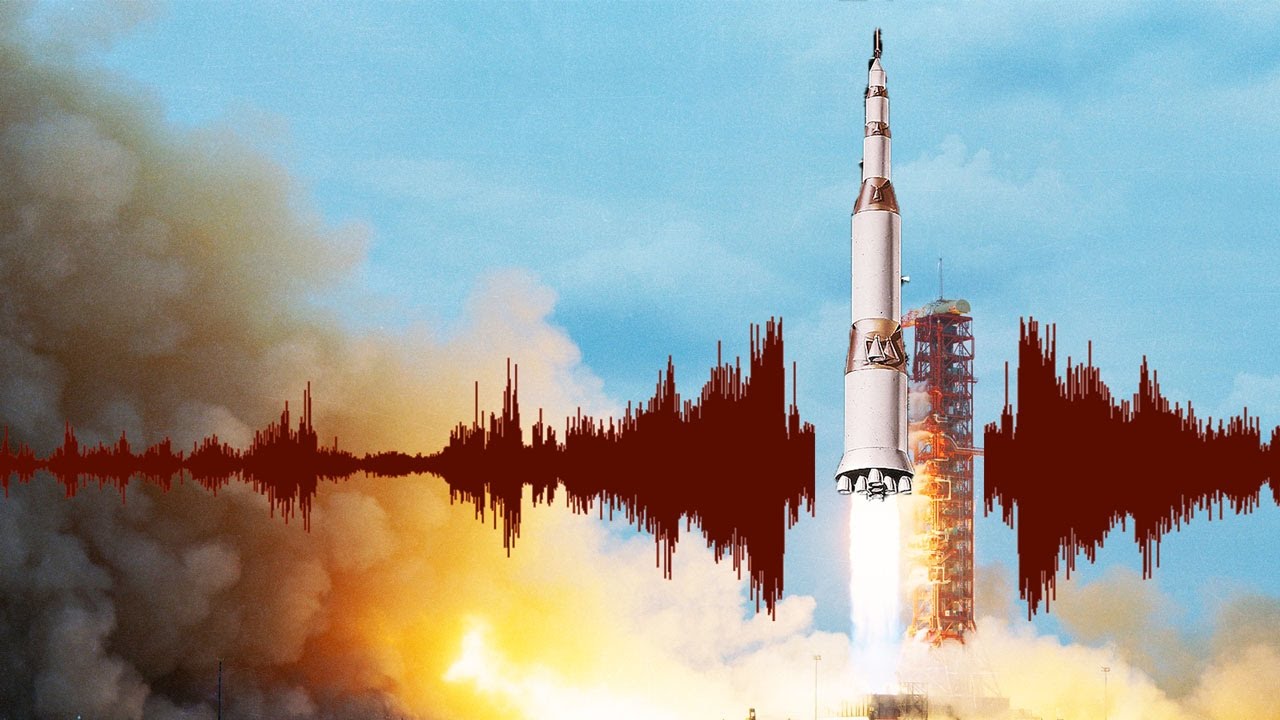
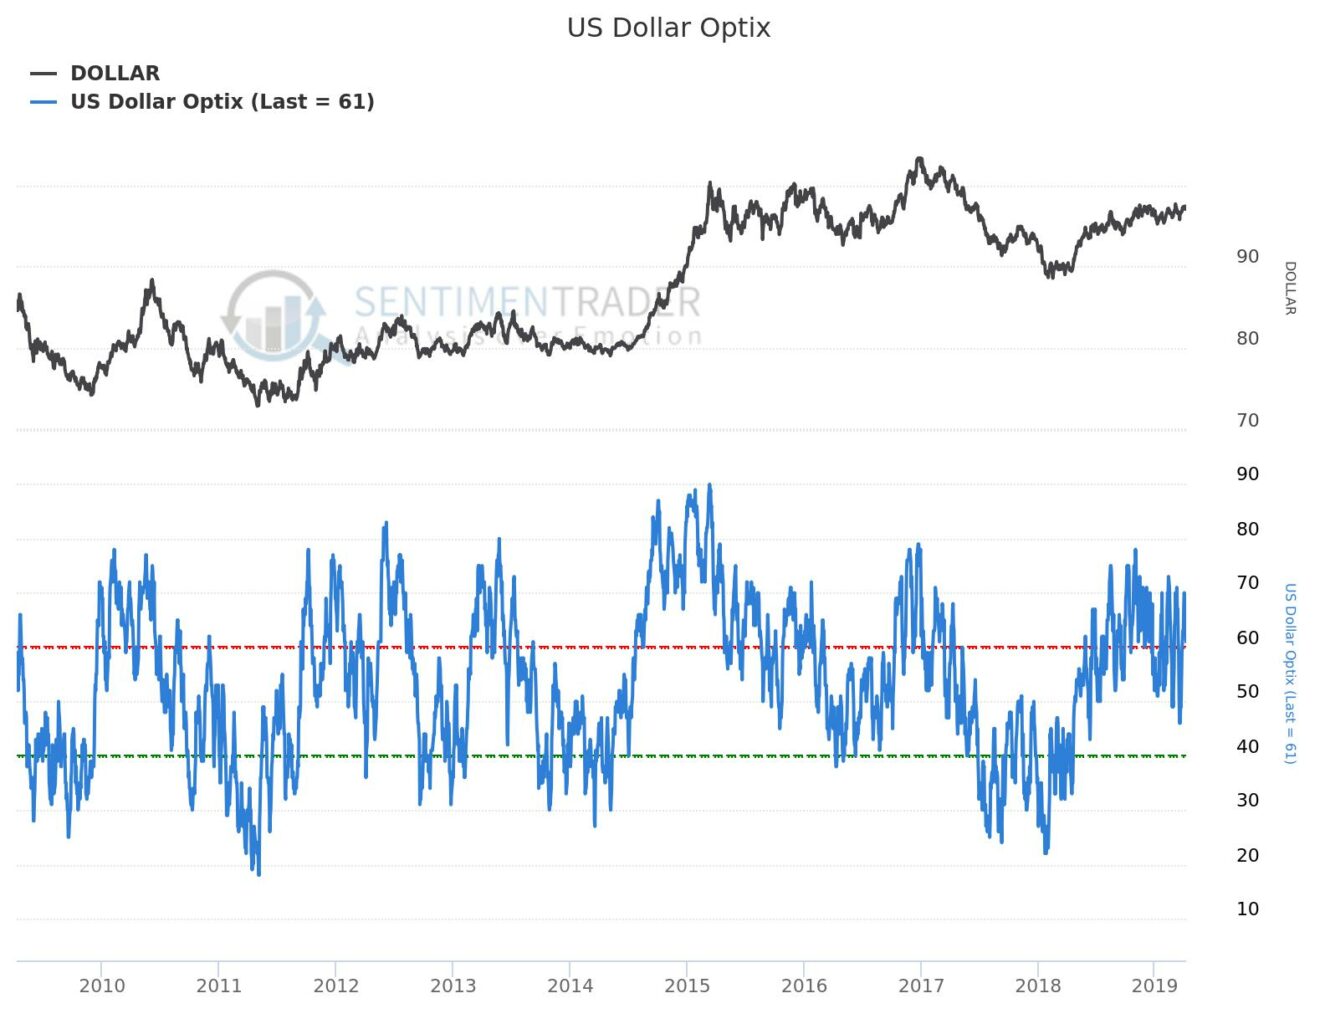
The flipside of the subdued sentiment towards gold despite its recent rally is the bullish extreme in the dollar even as it has failed, for the better part of a year now, to rally above its own resistance.
Looking at the technical picture in the dollar it’s clear that the 61.8% Fibonacci retracement level has posed key resistance now for quite some time. While churning beneath this level the greenback appears to have formed a possible head and shoulders top pattern, an echo of the pattern that marked its top 30 months ago.
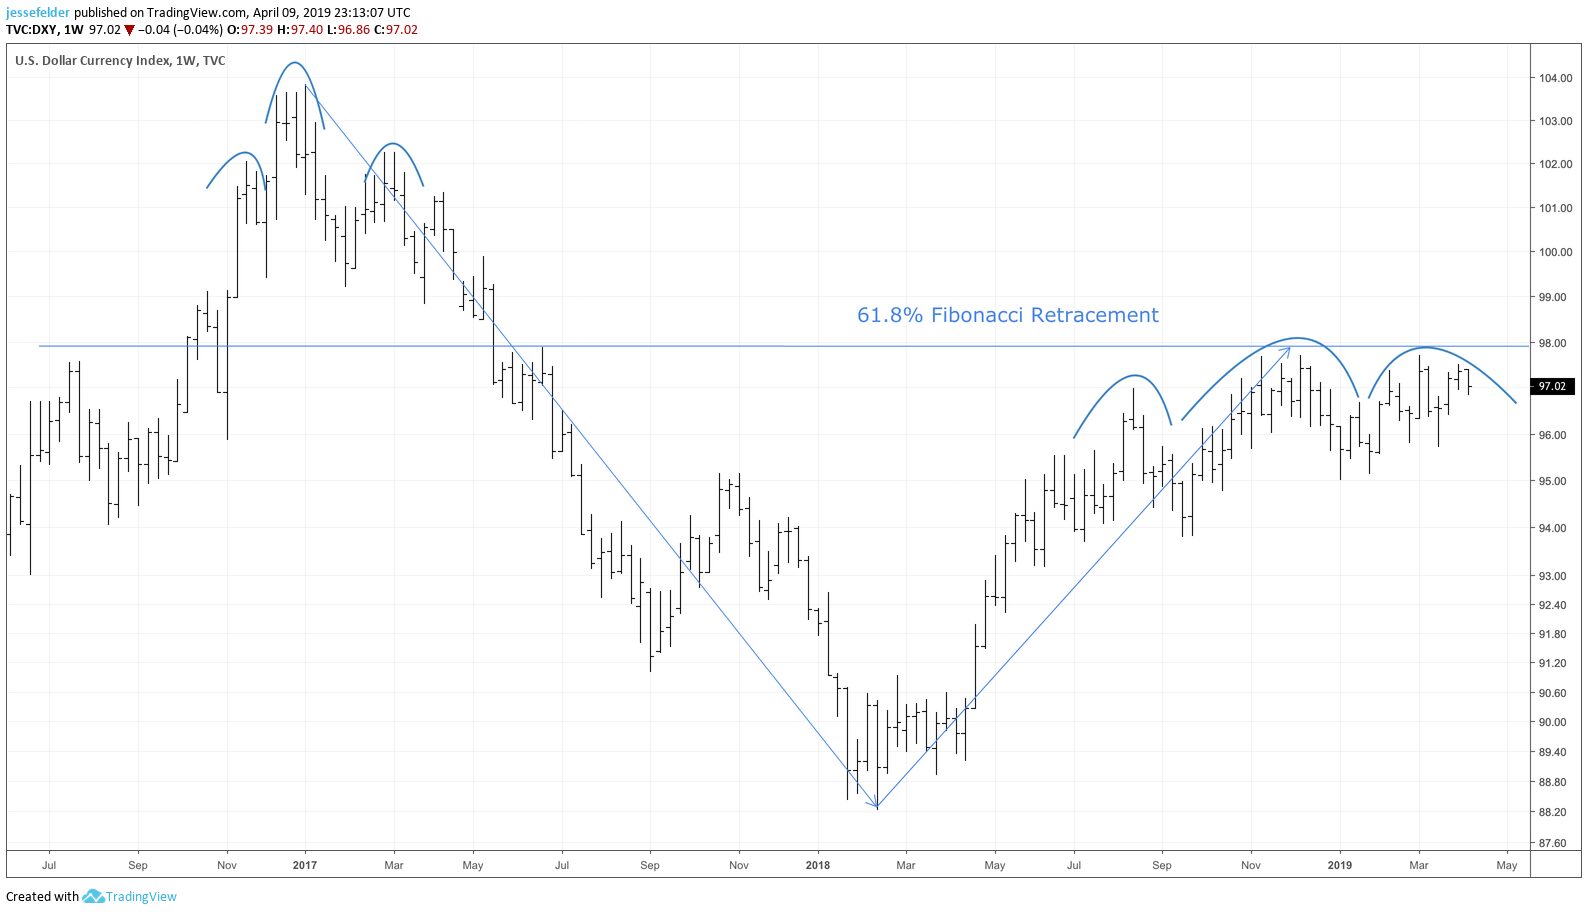
It’s also fascinating to discover that this pattern comes within an almost identical pattern on a longer-term time frame. That peak 30 months ago in the dollar came right at the 61.8% Fibonacci retracement of its long-term decline after peaking in early-2002.
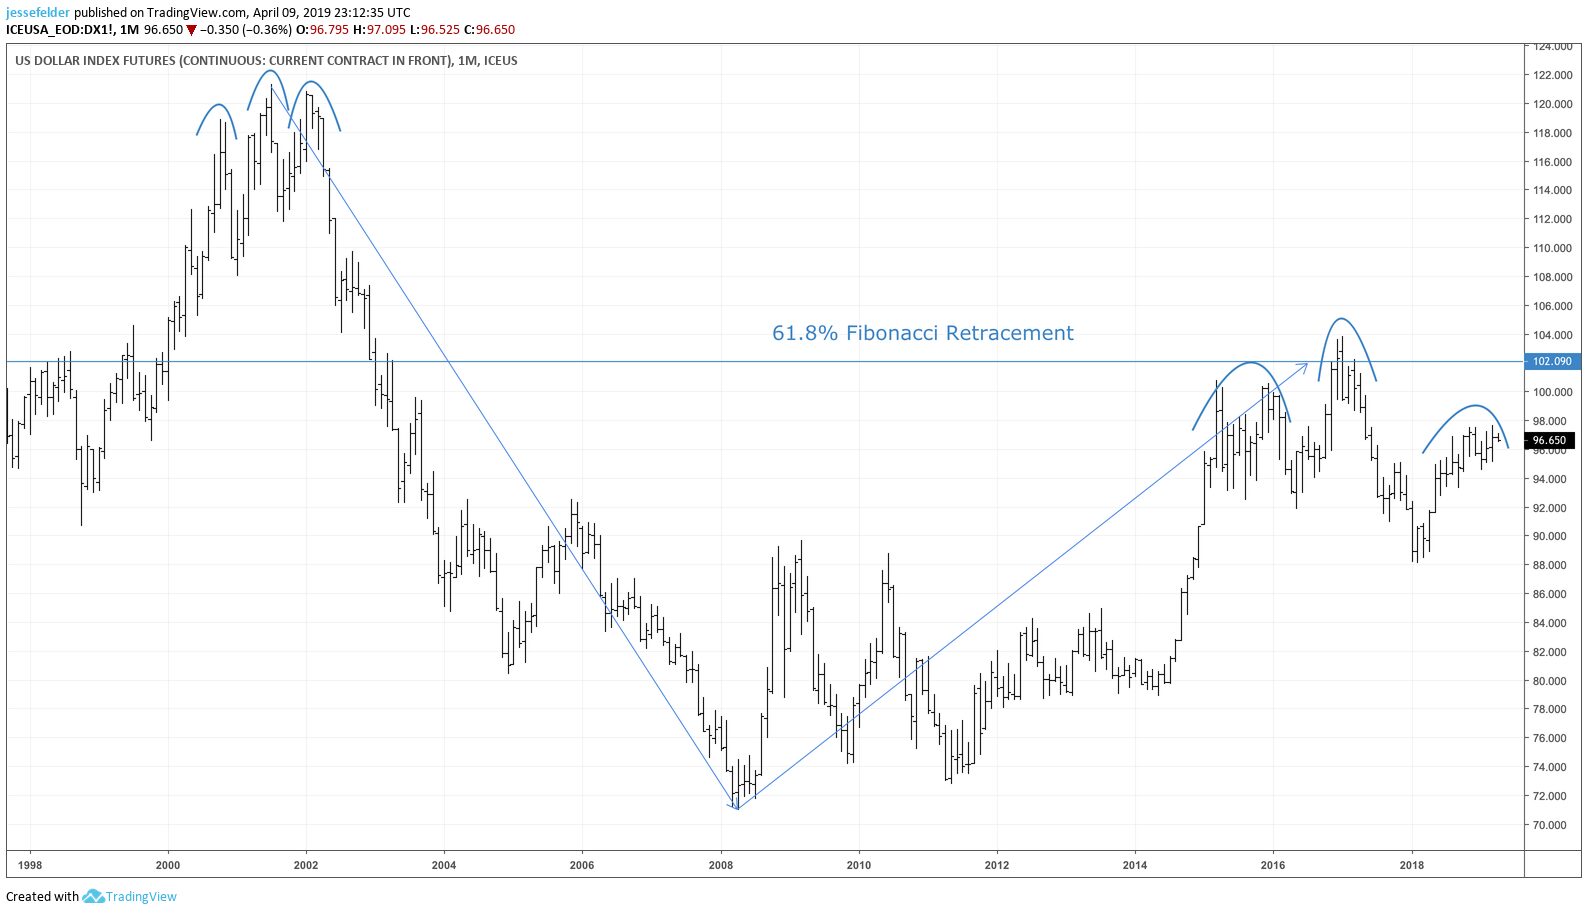
Looking at the primary fundamental driver of the dollar it’s interesting to note that, just like it did back in 2002, the dollar is trying to swim against a very strong tide presented by a widening fiscal deficit. If the yield curve is right and recession is coming then the dollar is likely headed much lower over the next few years.
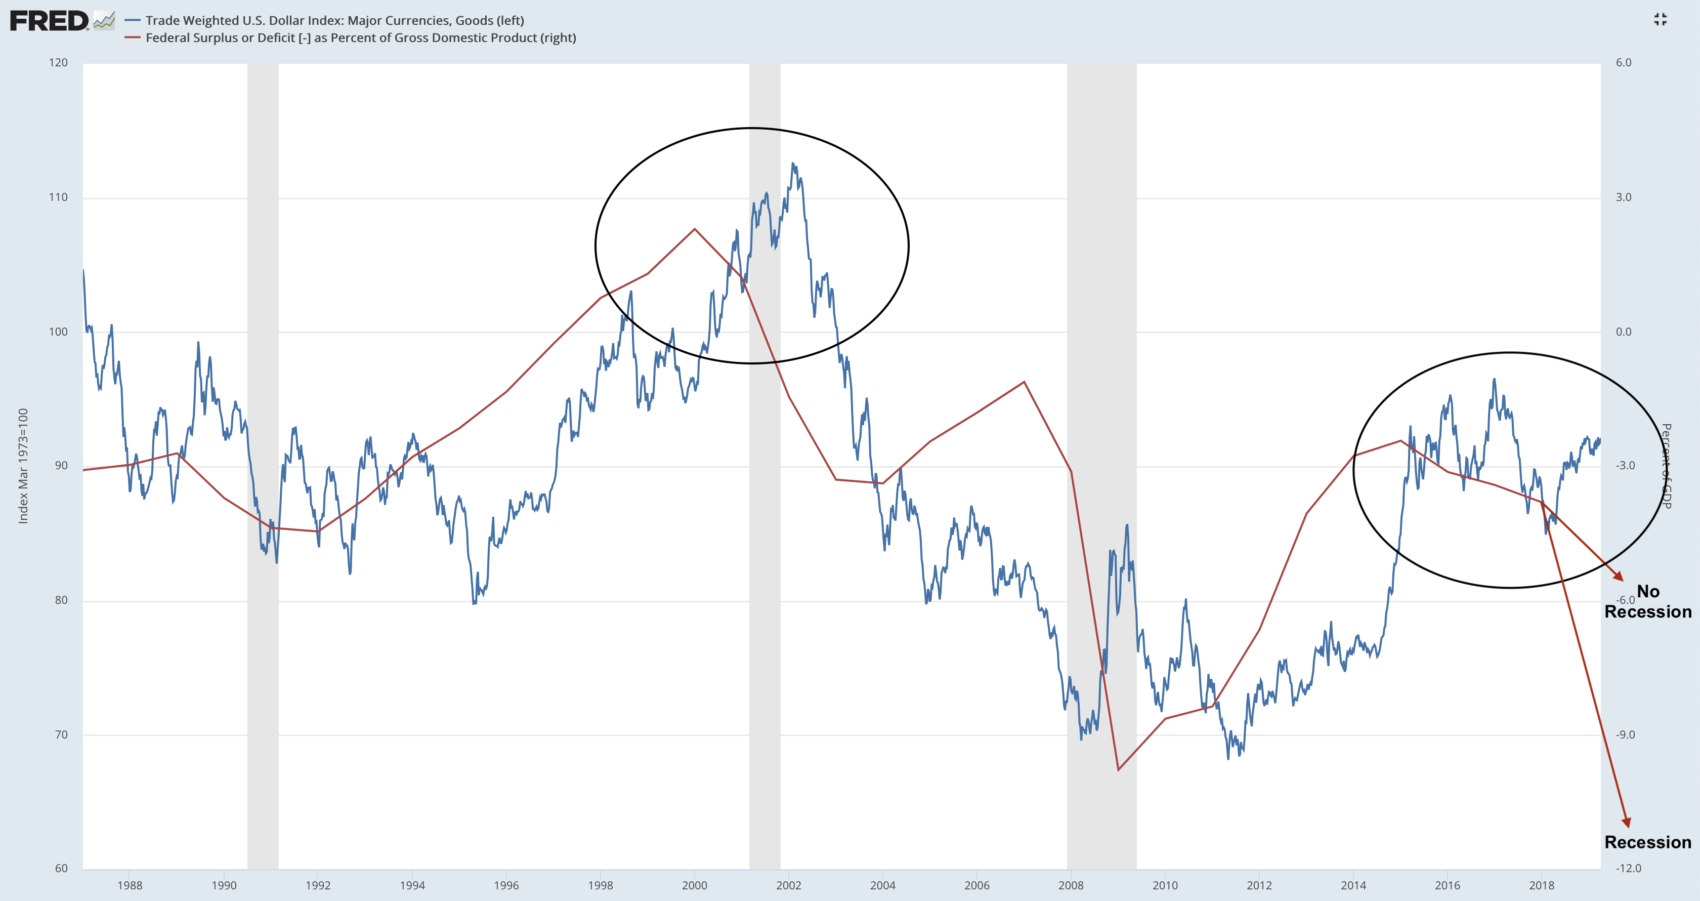
Even without recession, though, it appears as if the dollar is vulnerable to another reversal to the downside hat could be the catalyst for a breakout higher in the gold price.
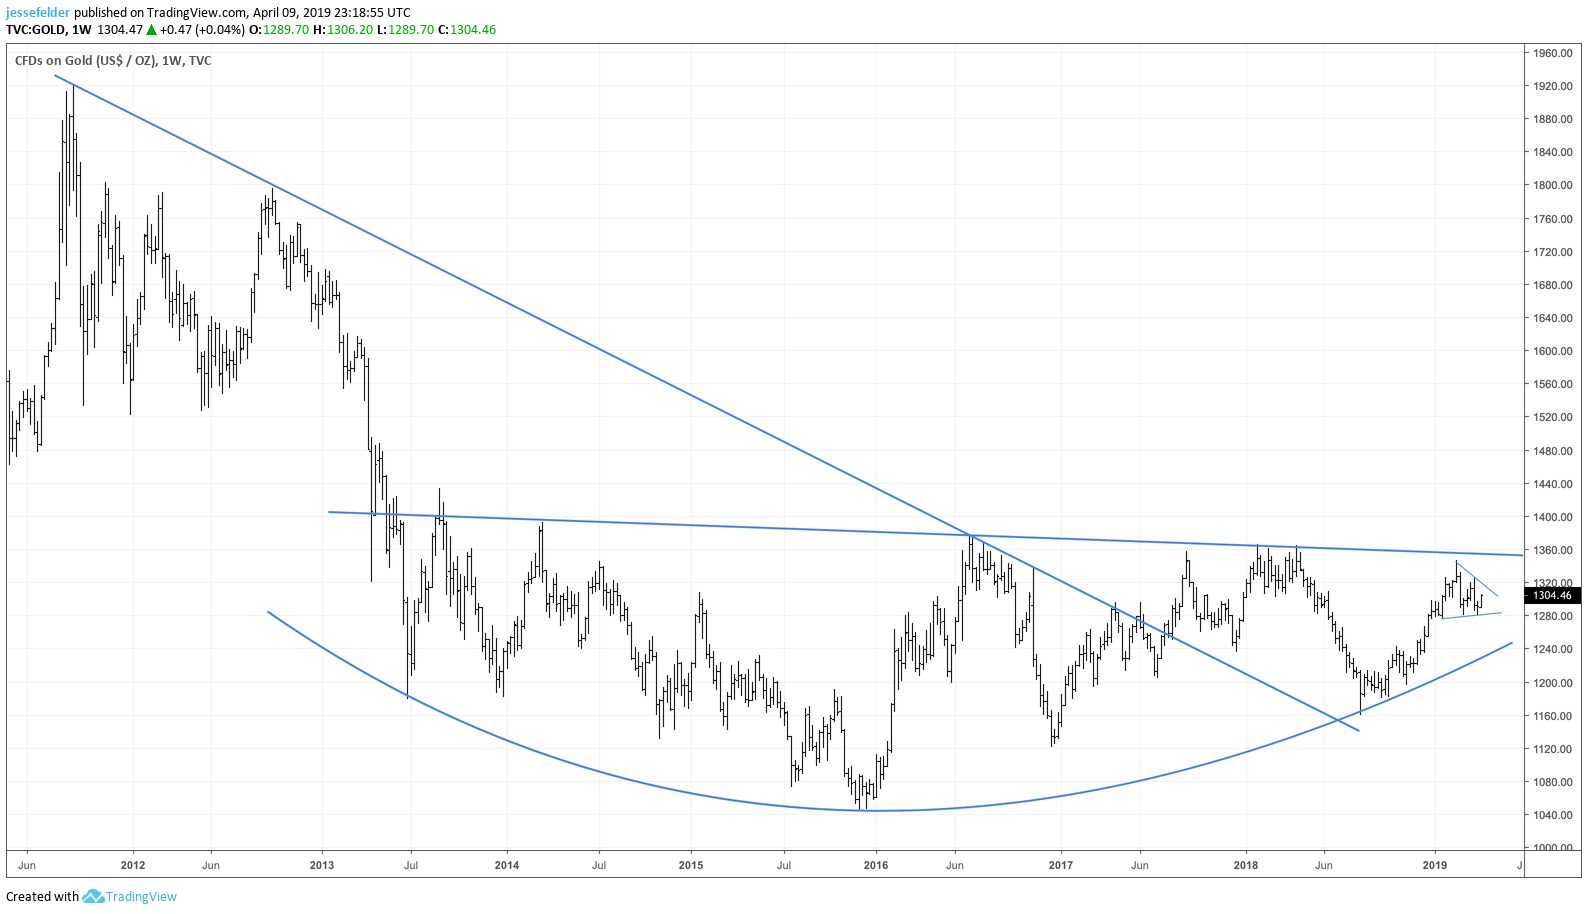
The chart below plots the current gold price (black) against its 2002 price pattern (gold). It looks as if this may be another example of the markets rhyming with history yet again.