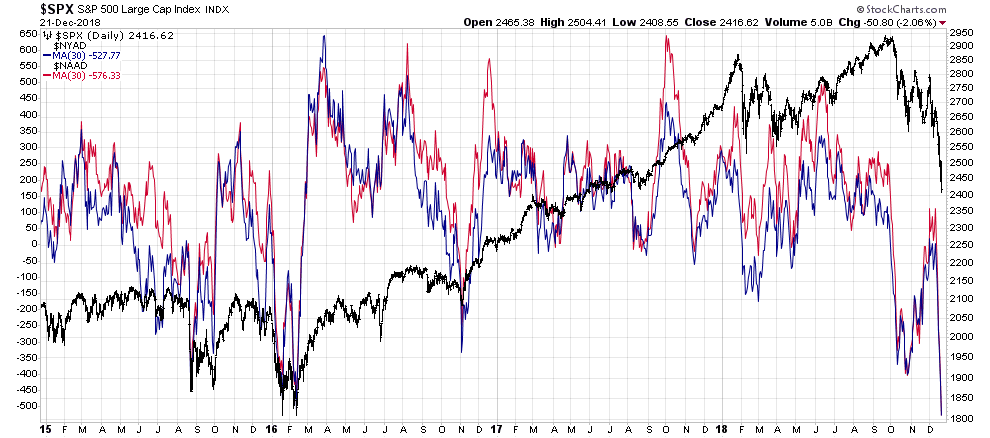
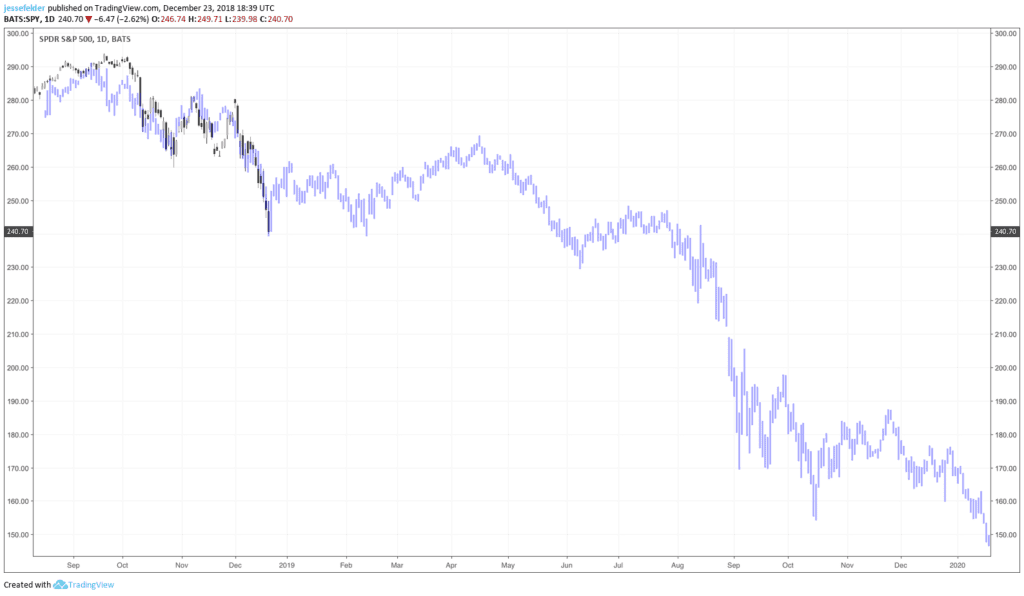
In fact, they say the most violent rallies occur only during bear markets. Well, we are finally starting to see some signs pointing to a rising probability of an intermediate-term low being put in by the broad stock market. The extreme oversold reading we can see at present, based upon the 30-day moving averages of the NYSE and Nasdaq advance-decline lines, is pretty rare. Even in bear markets, readings like this usually mean it’s difficult for stocks to continue to decline.
The number of stocks making new 52-week lows on the NYSE also finally hit a level that normally marks a washout and, in fact, there were fewer new lows made on Friday than Thursday even as stocks continued to decline, a potential positive divergence.
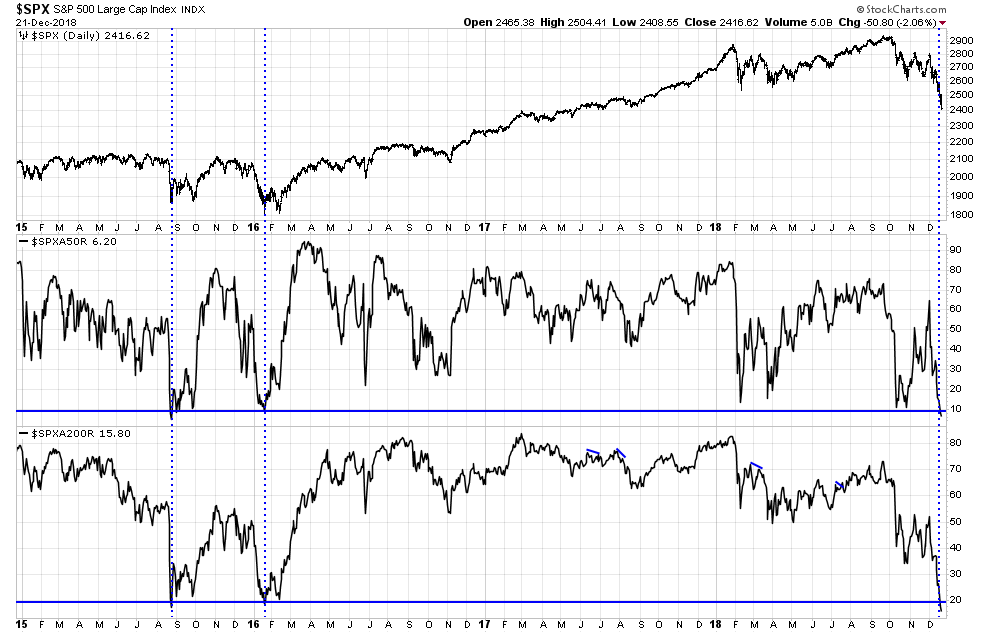
The percent of stocks trading below their key moving averages also points to the growing potential for a bounce in stock prices. However, it’s clear when you look back at 2015 and 2016 that a retest of the lows was usually in order after such a relief rally.
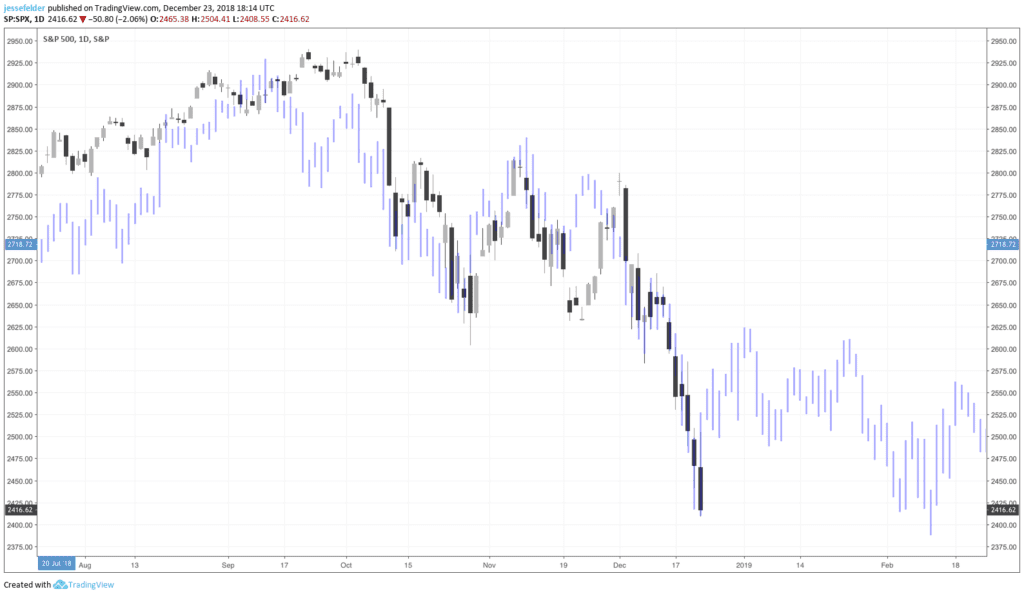
The message from our 2007 analog is the same: stocks have an opportunity to rally over the next couple of weeks, relieving the current oversold condition.
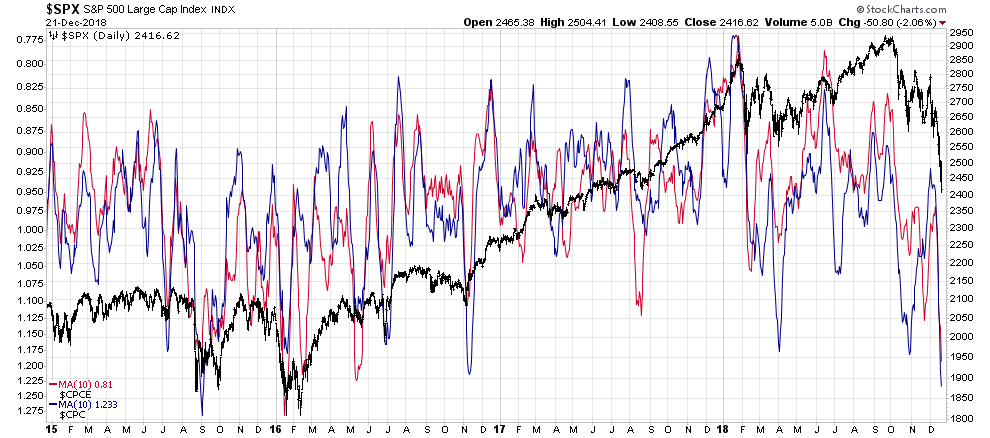
It’s also worth noting that, like breadth, sentiment in the options market has also pointing to a washout condition. The 10-day moving average of the equity put/call ratio is now at its lowest point since the August 2015 mini-crash.
As Jason Goepfert pointed out yesterday, when small options traders get this bearish it has been a good contrary signal in the past, at least for a one-to-two week trading period.
This past week, the smallest of options traders bought to open 2.9 mln put options. That's 27% of their options volume. Since January 2000, only five other weeks saw them panic this much. pic.twitter.com/mrN1AA3eus
— SentimenTrader (@sentimentrader) December 22, 2018
The volume traded late last week was also indicative of panic selling.
27 billion shares traded on U.S. exchanges Thursday and Friday, the most for any two-day period in seven years. Trading this week was 40% higher than the average before Christmases going back to 2008. The holiday spirit has been replaced by panic. https://t.co/m8gPuPfG5a pic.twitter.com/yqDAekSoew
— Jesse Felder (@jessefelder) December 22, 2018
As my friend Tom McClellan points out this is another indicator that can signal short-term lows.
Very high volume days in SPY and QQQ are a sign of price bottoms. See https://t.co/iup8OY4Cy5 Low volume days can mark a top, but be careful around holidays like Thanksgiving and Christmas when interpreting low volume days. https://t.co/7iWQ6N92Ec
— Tom McClellan (@McClellanOsc) December 20, 2018
Put it all together and it seems there may be a good chance for a several-week to several-month bounce that begins at any time. That said, it would be overly optimistic to expect anything more than a bounce as history suggests that even if stocks do experience a relief rally it is highly unlikely to prove anything more than just that, a countertrend rally that eventually leads to, at best, a retest of the lows and, more likely, an eventual continuation of the downtrend. While our 2007 analog is not likely to continue to work as well as it has recently, it does give a good picture of what is possible for stocks over the next 18 months or so.
As Carmen Reinhart points out, there are some interesting parallels between then and now in the debt markets.
Carmen Reinhart: The biggest emerging market debt problem is in America. And the networks for financial contagion, should things turn ugly, are already in place. https://t.co/V1HuS9IlVw pic.twitter.com/V3Adu09DK7
— Jesse Felder (@jessefelder) December 23, 2018
As Robert Shiller has discussed a crash narrative could be taking hold again today which may become a self-fulfilling prophecy.
'A narrative spread before Oct. 19 that it was dangerous, and fear of portfolio insurance may have been more important than the program trading itself.' –@RobertJShiller https://t.co/GwE07J4CAH
— Jesse Felder (@jessefelder) September 7, 2018
The current narrative is centered upon algorithmic trading and is, in fact, very similar in many ways to the portfolio insurance narrative that drove the 1987 crash.
"You start asking the question, 'Why is the stock market down 20%? Why are credit spreads so much wider?' And there are really no simple stories. That's why people begin to talk about explanations that can't be understood very well by financial markets." https://t.co/XZ4k0Quuh0
— Jesse Felder (@jessefelder) December 23, 2018
The potential for another dangerous feedback loop right now is very high.
"It’s kind of a feedback loop. We’ve seen some declines, and that emboldens some pundit to say, ‘This is it.’ They get attention, it puts thoughts in people’s minds and they start thinking, ‘Maybe I should exit.’" –@RobertJShiller https://t.co/h3di7R5jIS pic.twitter.com/qVW340EUpB
— Jesse Felder (@jessefelder) December 23, 2018
For these reasons, I believe traders should avoid trying to catch any sort of rally by getting net long. If a rally does, in fact, materialize it may prove to be a wonderful opportunity to sell or at least put on hedges for those still overexposed to equities. Personally, I have reduced my overall net short position by covering some shorts and adding to some longs but remain fully hedged. I intend to use any strength in stock prices over the next week or two to add to short positions again.


