
I think it helps to think of the market cycle like a rocket. It takes a massive amount of fuel and force to get the thing off the ground (the majority of stocks working together to establish a new bull market trend). As it progresses higher into the heavens and the stages of the rocket are used up (the bull market for many individual stocks expires) they fall away leaving just the capsule at the tip (and small group of megacap favorites). Eventually, without any fuel left to propel it higher, it also falls back to earth (and the bull market gives way to the bear).
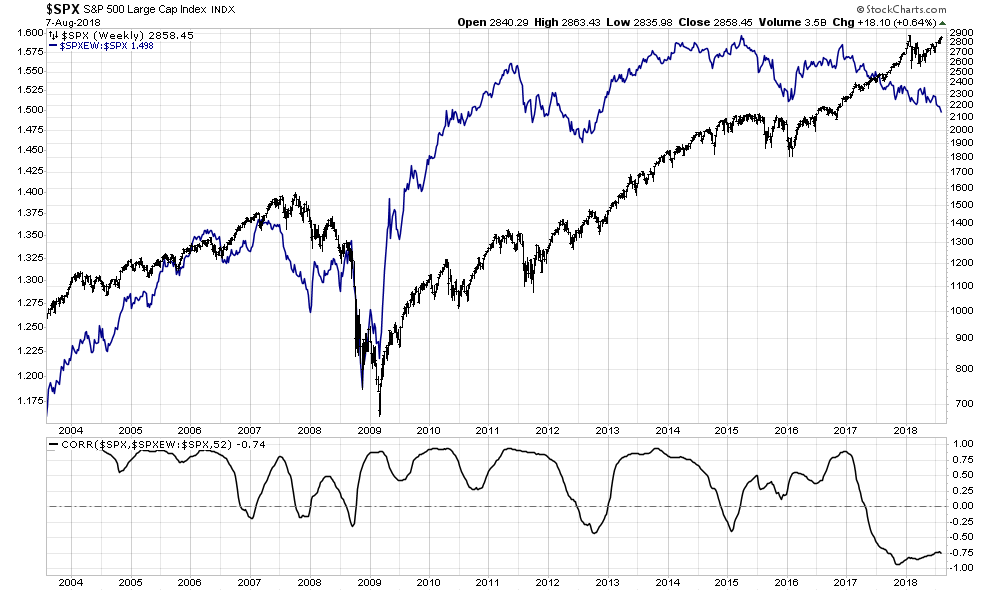
As the stock market continues to trickle higher amid the typical summertime low-volume trading environment the divergence in breadth only continues to grow more dramatic. Perhaps the best representation of this is the widening spread between the S&P 500 and the ratio of the equal-weight version of the index to the market cap-weighted version. The smaller index components have been lagging behind the rising index to a sustained degree not seen in very long time if ever. This is precisely the sort of narrowing breadth seen during a topping process.
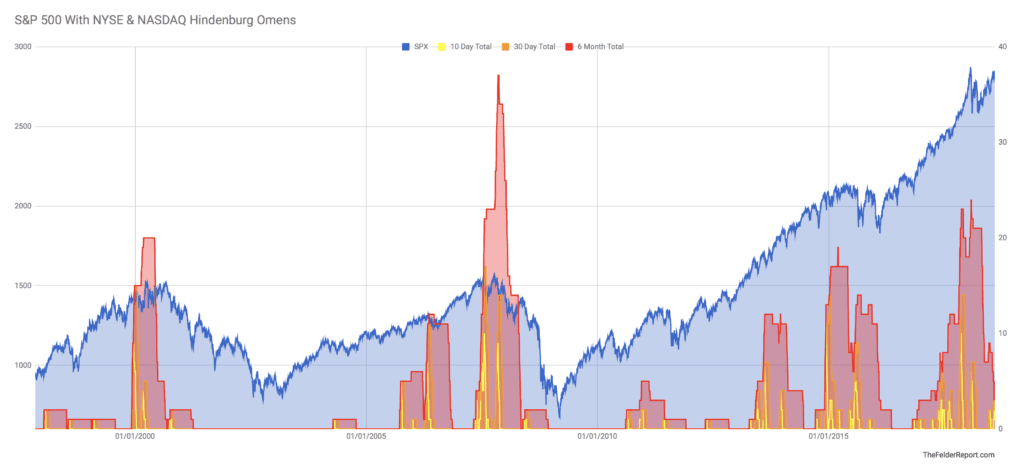
Another way to visualize this is simply by tracking the number of Hindenburg Omens triggered on both the NYSE and the Nasdaq over a given period of time. As I noted early this year the 6-month total recently hit a level only seen at major market peaks over the past couple of decades. Recently, the Nasdaq has triggered another 3 omens of its own suggesting a renewed dispersion in breadth. These sort of echoes coming after an initial surge are also fairly typical during a topping process. Note the echo in late-2000 after the surge early that year. More recently, there was a sizable surge in early-2105 followed by a smaller echo late that year that preceded the swift decline in early-2016.
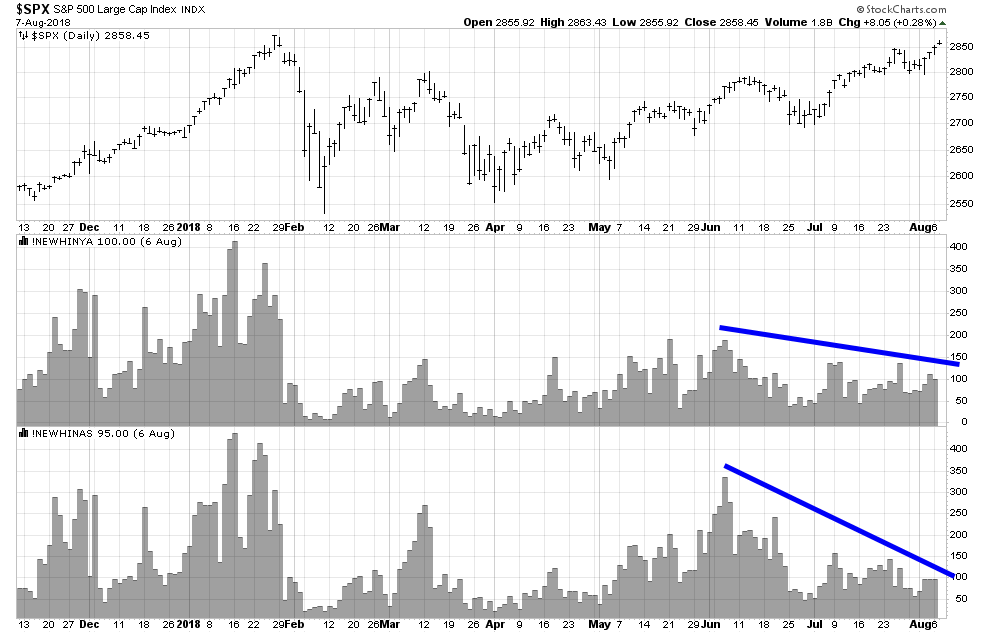
Hindenburg Omens are triggered when there is a concomitant surge in both new highs and new lows as the index sits near its highs. But looking at just the number of new highs in the Nasdaq and the NYSE it’s very clear that the current attempt to breakout above the January high for the S&P 500 is not only far weaker than the last time the index saw these levels it has also been weakening steadily for the past couple of months.
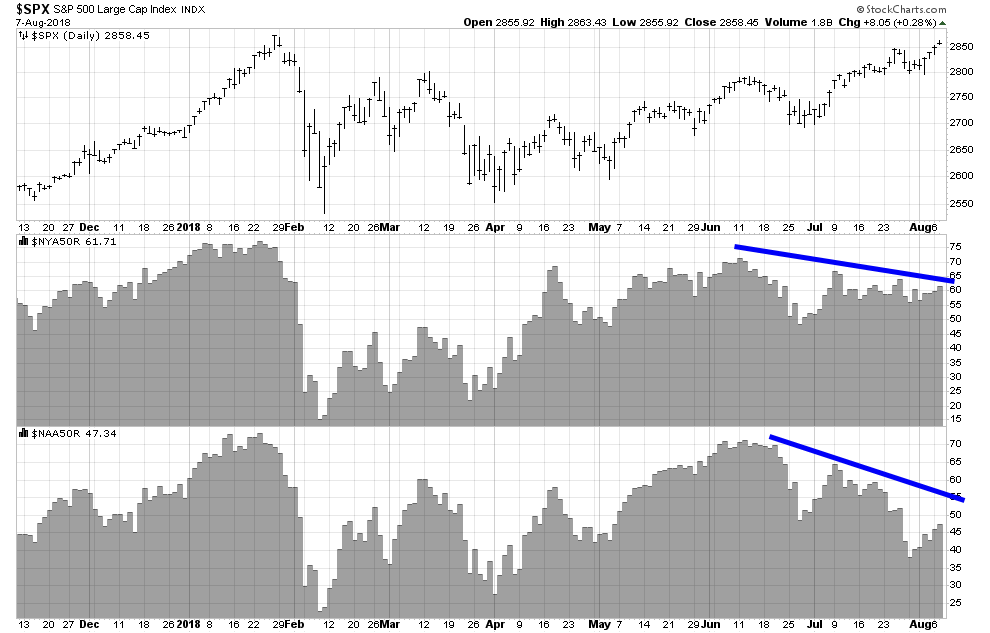
The same can be said of the percent of stocks on both indexes trading above their 50-day moving averages. Early this year as the index put in its January high this reading was at 75%. Back in June it touched 70% and today its sitting at 62% for the NYSE and just 47% for the Nasdaq. In other words, as the Nasdaq sits at new highs for the year less than half of the stocks that trade there can say the same. This falling off in participation suggests the current short-term uptrend is vulnerable to a reversal.
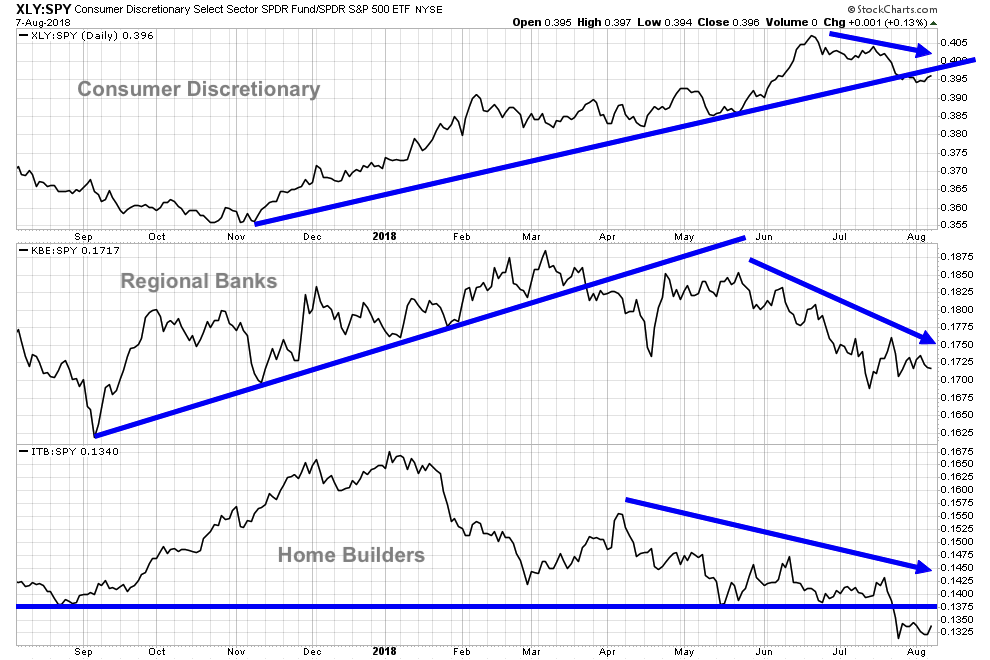
Finally, looking under the surface of the major indexes to their component sectors yields another interesting observation. Those pro-cyclical sectors that have been leading the market higher over the past couple of years have now started to underperform. Consumer discretionary, regional banks and home builders are all now, in some respect, reversing in terms of relative performance.
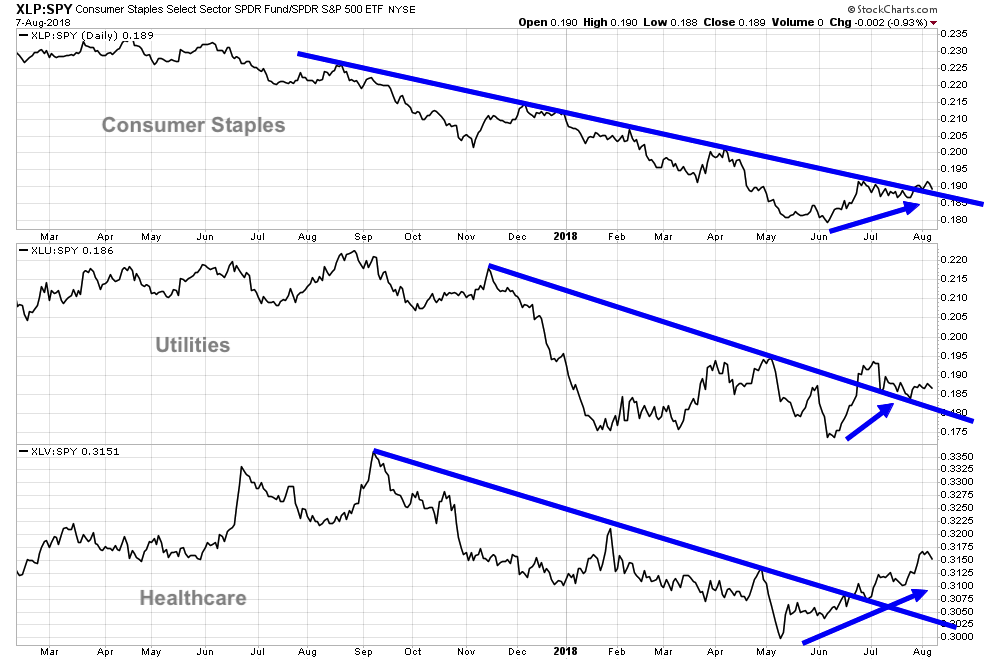
At the same time, defensive sectors have been leading the broader market higher over the past couple of months. Consumer staples, utilities and healthcare have all been showing relative strength over the past couple months. This is rare during an uptrend for the broader market. Typically, these sorts of sectors lead during a broader market decline.
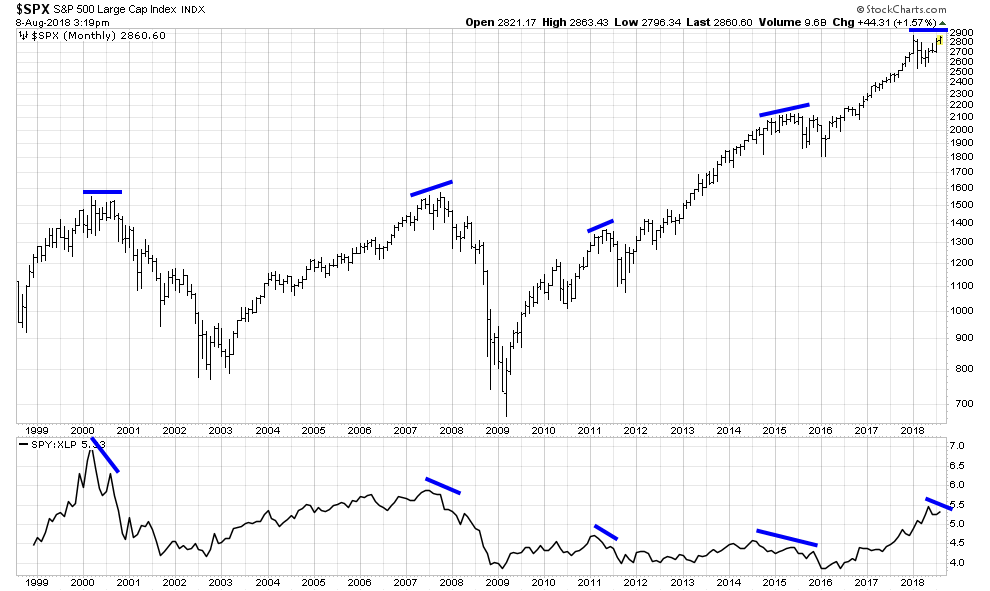
To demonstrate, just look at the relative performance of the S&P 500 versus the Consumer Staples sector at intermediate and long-term peaks over the past 20 years. When this measure has diverged it has been a good indication of rising risk aversion among investors, the sort of risk aversion that leads to a broad market decline.
All in all, the breadth dispersion in the market currently makes the retest of the highs from earlier this year suspect. Furthermore, the nature of the breadth divergence suggests risk aversion is rising rather than falling. For these reasons, it appears this retest of the highs is more likely to fail than to lead to a sustained breakout. And, due to the long-term significance of these breadth warnings, a failure here could eventually prove to be an equally significant turning point. In other words, it looks like it’s only the final capsule left floating in space right now just waiting for the optimal point of reentry into the earth’s atmosphere.