Gold continues to plumb new lows but I continue to see signs that it’s ready to reverse and possibly reverse hard. The daily chart shows the price of the precious metal potentially forming a bullish hammer today. It’s also likely that it will complete a 9-13-9 DeMark Sequential buy signal on Friday’s open (so long as the price at that time trades below Monday’s close). We also have a short-term bullish RSI divergence working.

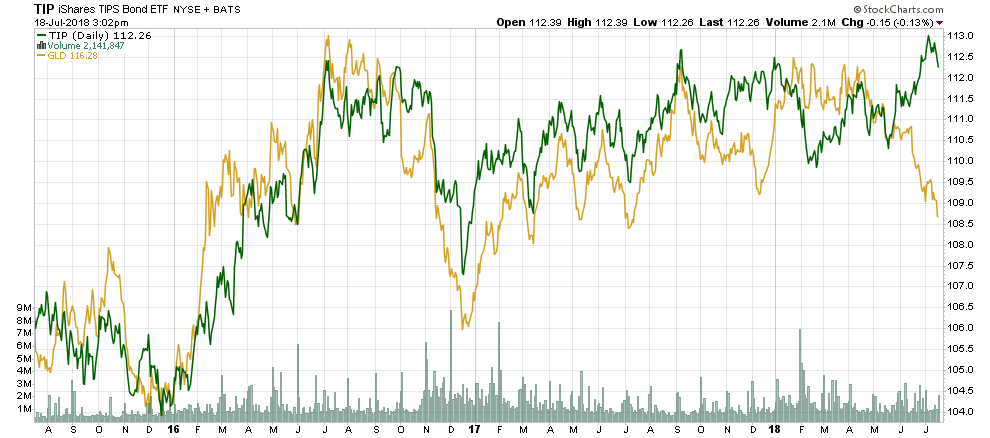
But what really intrigues me right now about the price of gold are several major divergences. The first is the discrepancy between the recent action in gold and that in TIPS. The latter has been very strong in response to rising inflationary trends while the former has gone the other way.
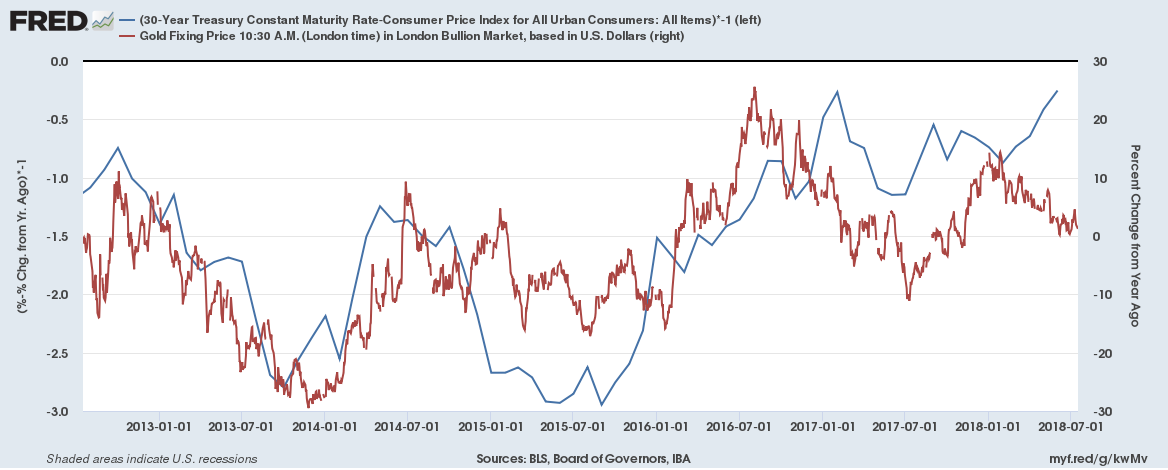
This failure of gold to respond to rising inflationary pressures can also be seen in the chart below which tracks the year-over-year change in the gold price to the year-over-year change in the real 30-year yield (inverted). All else being equal the gold price should probably be up about 25% from its level one year ago, which would put it around $1,550, simply as a function of rising inflation and relatively static bond yields.
It appears what’s happened is gold has given up paying attention to inflation and instead started tracking the yuan. This has led several gold watchers to speculate some sort of manipulation is occurring.
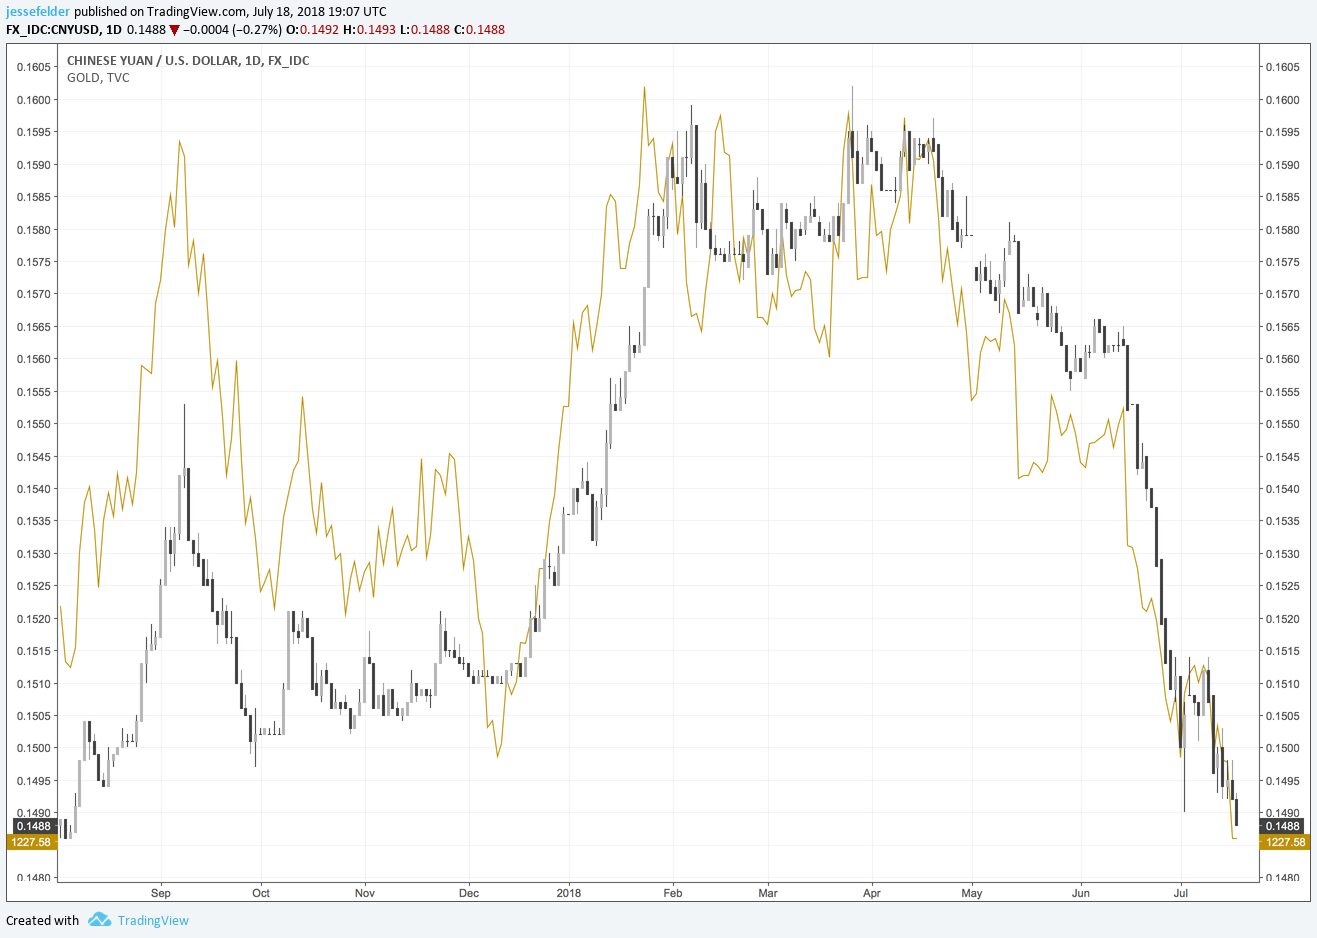
Certainly there could be some kind of algorithmic influence here but to my mind it simply reflects the overall extreme bullishness towards the dollar at present.
Speculators continue to boost their bets on the dollar. https://t.co/MYjDhVjQwI via @SoberLook pic.twitter.com/bsMJoD1qgu
— Jesse Felder (@jessefelder) July 16, 2018
The flip side of this dollar bullishness is gold bearishness which shows the greatest extreme since the early-2016 low.
Comex Gold Managed Money Positioning has been cut ~99.5%, a record. In-line with near maximum net short spec positioning. This at a time when gold Co-basis has begun to accelerate higher since mid-JUN. pic.twitter.com/ZHmm08rbe6
— DC (@dimit) July 17, 2018
Another divergence that caught my eye recently was that between the yuan and the spread between Chinese and U.S. 5-year yields. According the widening spread here the yuan should be much stronger than it has been recently and I attribute this also to the bullish sentiment surrounding the dollar possibly as a product of the rising trade war tensions. All this really suggests is that both gold and the Chinese yuan are susceptible to a rapid repricing of spreads and inflationary trends.
China 5yr less US 5yr in white, and inverted CNY in red.. @LukeGromen pic.twitter.com/trR2VIuMR8
— Rates Trading (@ratestrading) April 23, 2018
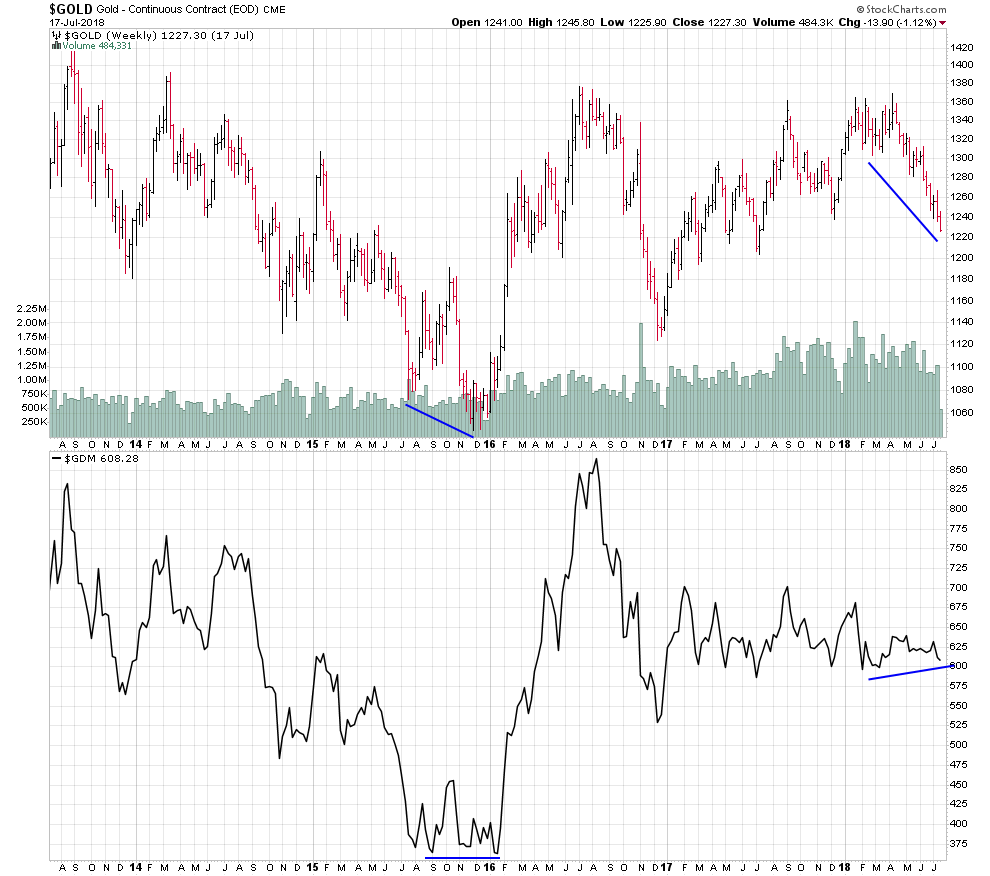
Perhaps investors in the gold mining shares see the potential for this sort of reversal. While the metal has made new lows the miners have held up very well, similar to the performance they put in at the late-2015 lows when gold broke down and the mining index held support. This suggests there could be a significant amount of accumulation going on in the miners at present perhaps by a large investor looking to take advantage of the weakness in the metal.
One other factor I’m watching closely is the deterioration in financial conditions. The Fed is draining liquidity and this should result in a move on the part of investors away from risk assets like stocks and corporate bonds and into traditional safe havens like treasuries and gold. And because inflation is rising gold may benefit more than treasuries.
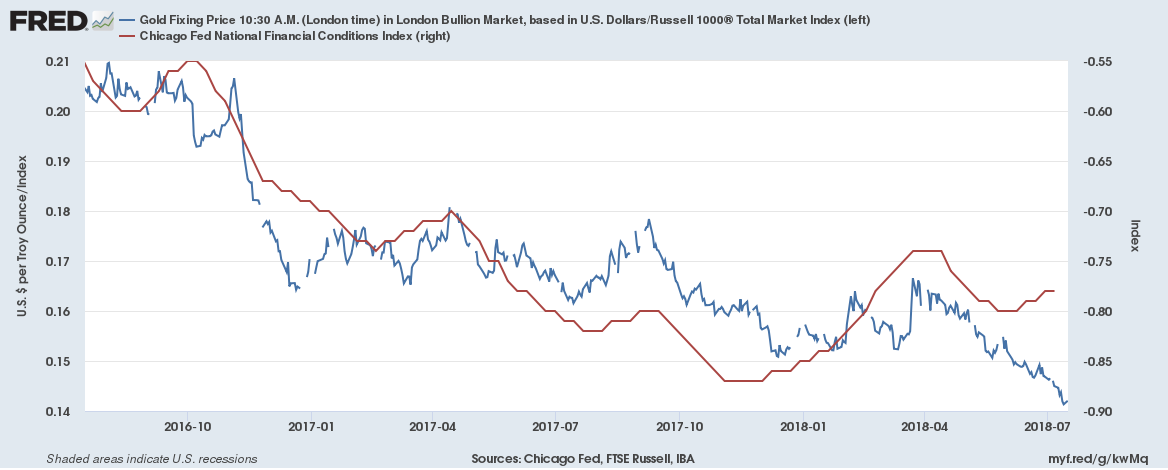
In fact, the divergence in the chart above suggests that the ratio of gold-to-equities has some catching up to do to match the reversal in financial conditions from its lows late last year. This could come as a function of weaker stock prices or stronger gold prices or some combination of the two. The longer the Fed continues on its tightening path the tighter financial conditions will get and the more probable a reversal in this ratio becomes.