
This is an excerpt of a post that first appeared in The Felder Report Premium.
“Even the most circumspect friend of the market would concede that the volume of brokers’ loans—of loans collateraled by the securities purchased on margin—is a good index of the volume of speculation.” -John Kenneth Galbraith, The Great Crash 1929
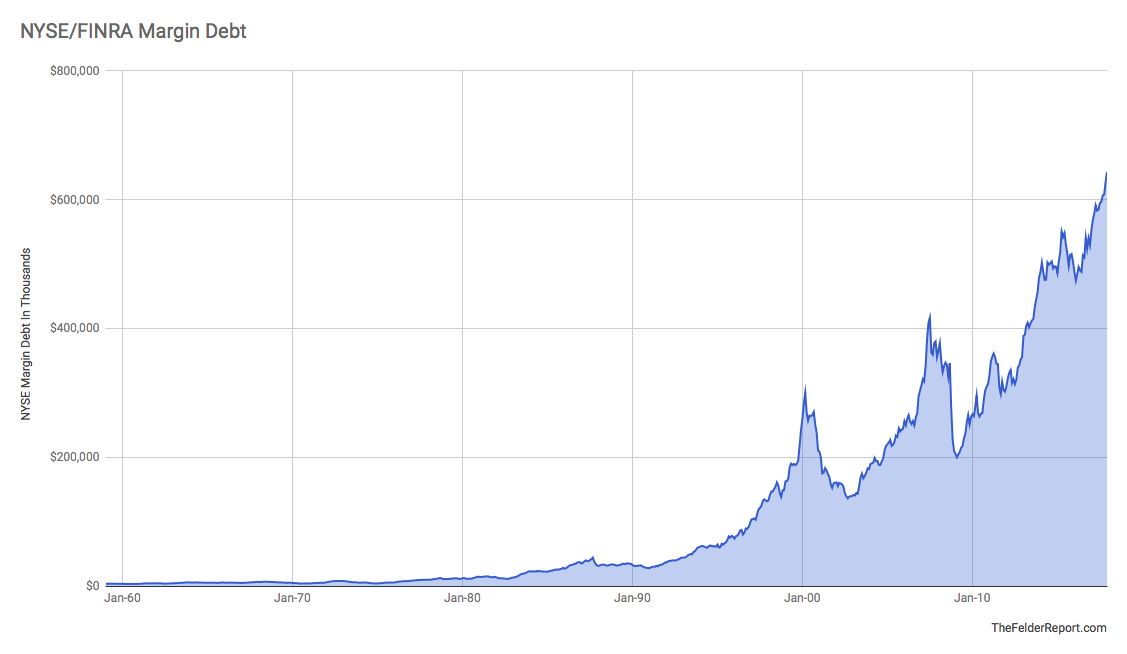
When it comes to stock market sentiment, I like to give more weight to measures that track investor positioning rather than sentiment surveys. I want to know what investors are actually doing rather than what they say they’re doing. To me, the level of margin debt shows the potential supply and demand for risk assets. When margin debt is low there is plenty of potential demand and when it’s high there is plenty of potential supply. Nominal margin debt recently surpassed $600 billion dollars for the first time on record, roughly twice the amount seen at the peak of the dotcom mania.
 Even when you normalize it by comparing margin debt to the overall size of the economy, margin debt has recently broken out to new highs. Notice in the chart below that for a long period of time, several decades in fact, investors were content to speculate in a leveraged manner to a very minimal degree. Even the 1987 margin debt peak in the chart below is just a ripple compared to the surge seen during the dotcom mania. There may be no better representation of the moral hazard created by interventionist monetary policy than the chart below. Ever since the “Greenspan put” came into existence just after the 1987 crash investors have embraced risk taking like never before and today’s it’s reached a new extreme.
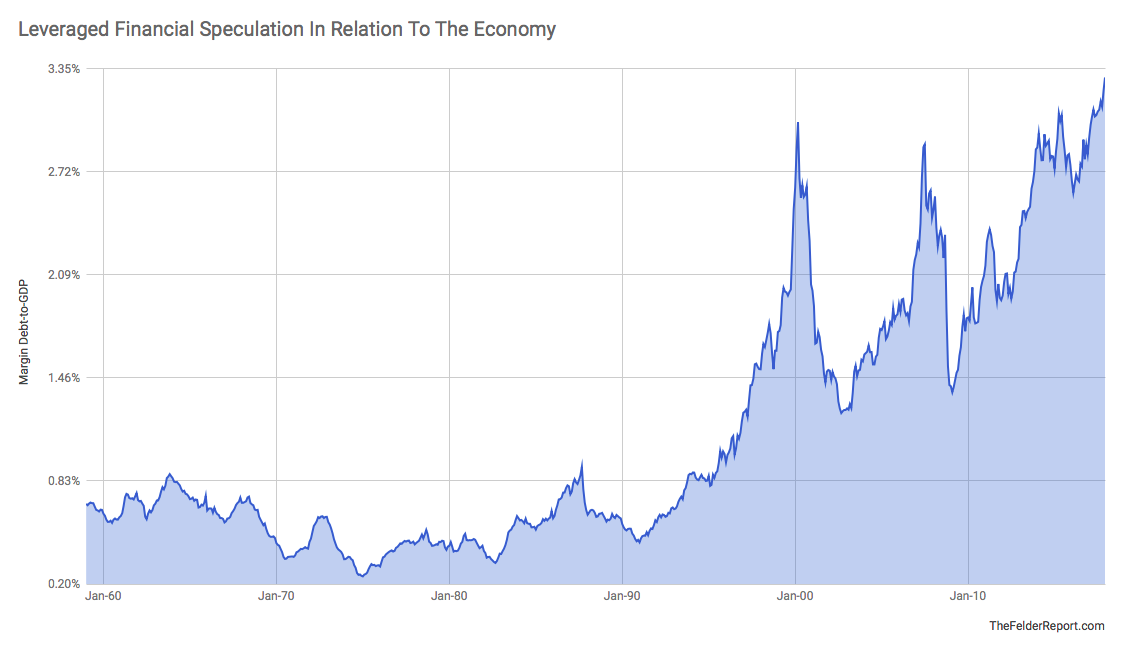 An interesting feature of margin debt relative to GDP is that since leveraged speculation has grown so much in relation to the economy, starting in the mid-1990’s or so, there has arisen an interesting negative correlation between the ratio and forward 3-year returns in stocks. For a long period of time, when margin debt was minimal in relation to the size of the economy, there was really no relationship between the two. But since the dotcom mania when margin debt has surged to represent roughly 3% of GDP it has regularly led to 50% drawdowns over the next several years. Margin debt reached this level in 2015 and, while it looked like stocks might embark on another major drawdown in early-2016, they reversed and relationship has yet to be reasserted. Still, the idea that the amount of forced liquidation can be a factor in the magnitude of a bear market makes intuitive sense and, at least over the past half century, we have never seen what this amount of margin debt, being unwound, is capable of producing in terms of downside risk.

Looking back further in time, margin debt reached roughly 6% of GDP just prior to The Great Crash of 1929. We are just above half that level today but these current numbers also don’t include asset-backed loans which have become very popular at the major brokerage houses. Additionally, in 1929, corporations were lending money in the call markets expanding the availability of credit for the purposes of speculation. Today, cash-rich companies like Apple are lending money into the corporate bond market instead, enabling companies to leverage up their balance sheets and buy back their own shares. Obviously, this also doesn’t show up in margin debt figures. There are other similarities between today and that earlier period and, of course, many differences. The only safe conclusion to draw from this “index of the volume of speculation” hitting new record highs is that downside risk, due to the prospect of forced liquidations, is as high as it has been in at least 89 years.

P.S. – Many thanks to Movement Capital for putting together the data.
NYSE is about to stop distributing margin debt data. it's now FINRA's job and they don't offer any historical CSVs. I compiled/cleaned everything up, spread the word. google doc: https://t.co/EuQBx6kOVZ
— Movement Capital (@movement_cap) January 17, 2018