
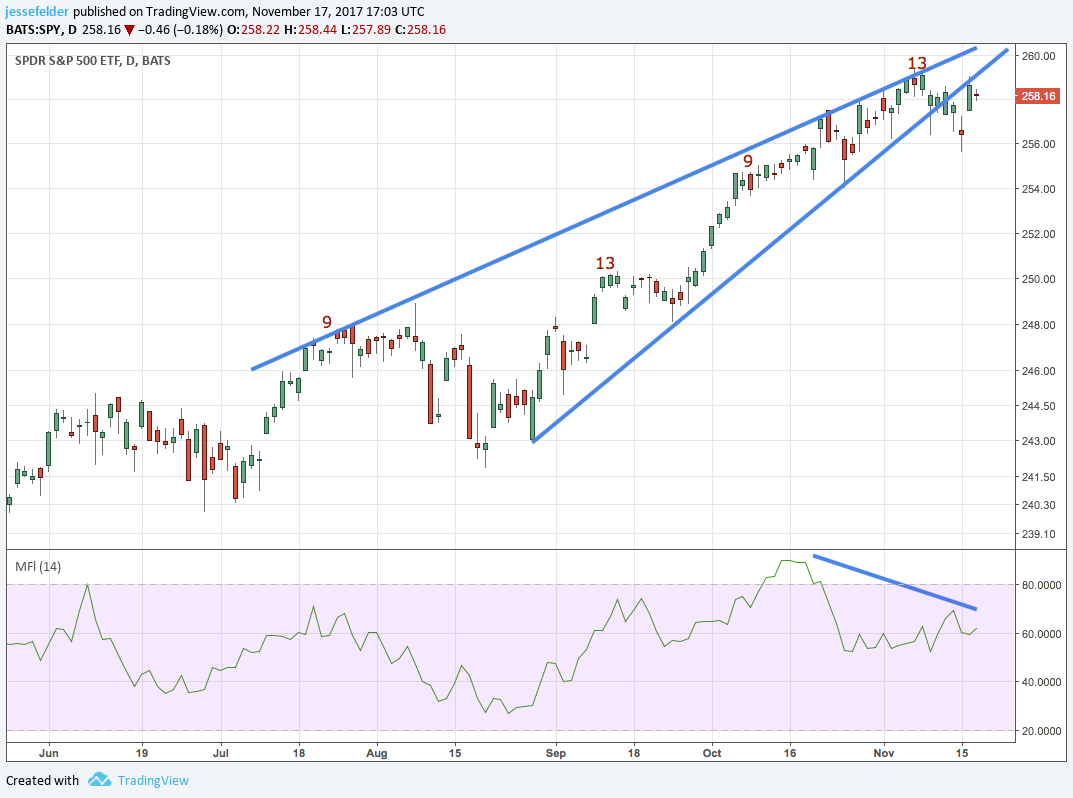
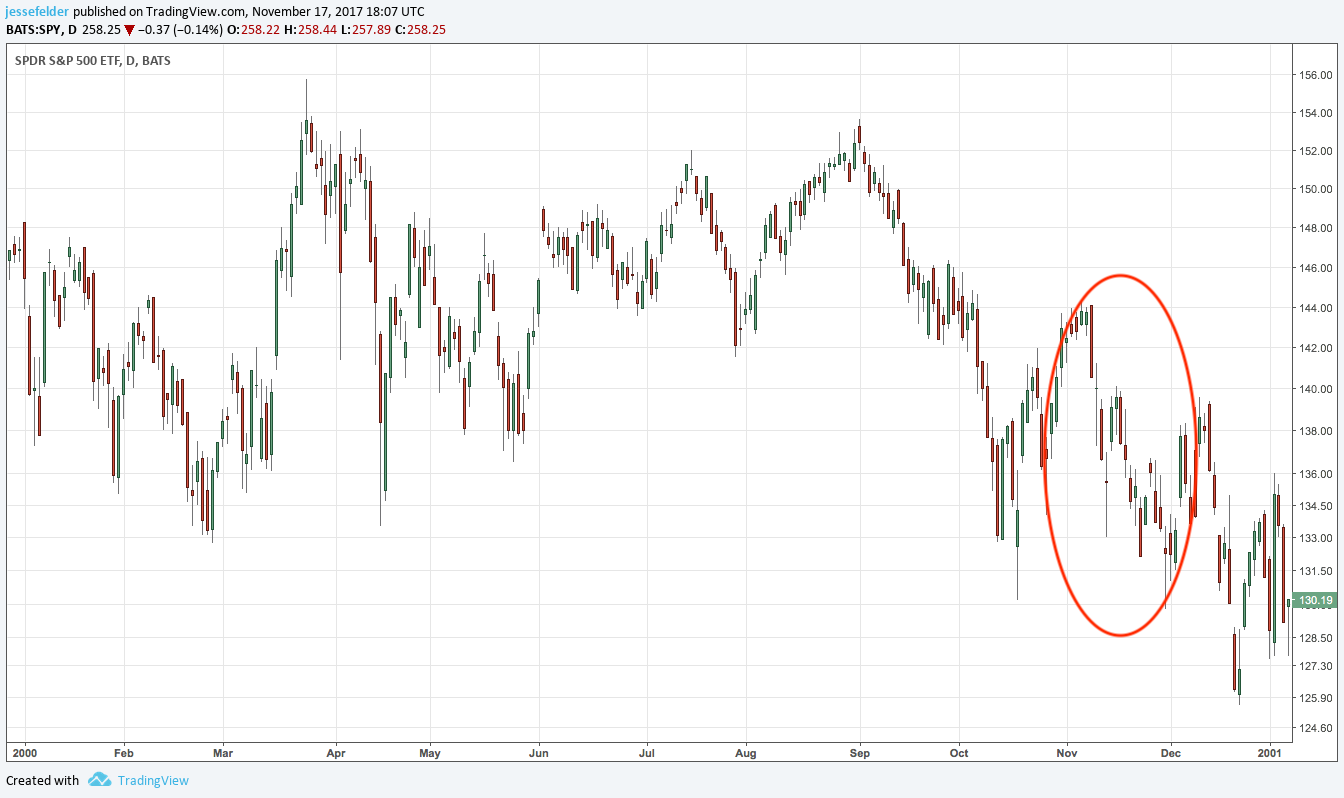
We now have a number of DeMark Sequential sell signals for the S&P 500 ETF (SPY) lining up across almost every major time frame. The daily chart below shows the 13 sell signal and subsequent breakdown out of an ending diagonal pattern accompanied by a bearish money flow divergence. The rally on Thursday has only managed to test the lower trend line from below.
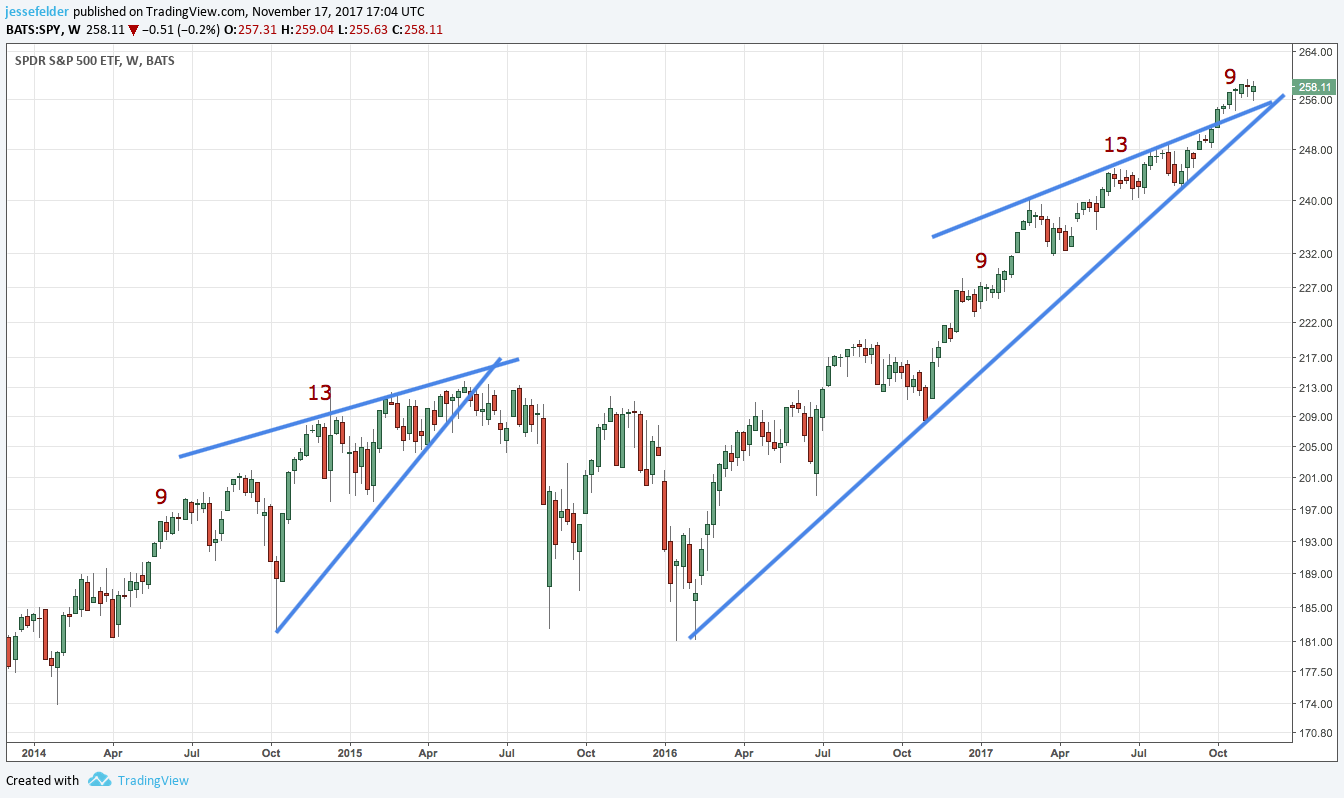
The weekly chart below shows a completed 9-13-9 DeMark Sequential sell signal.
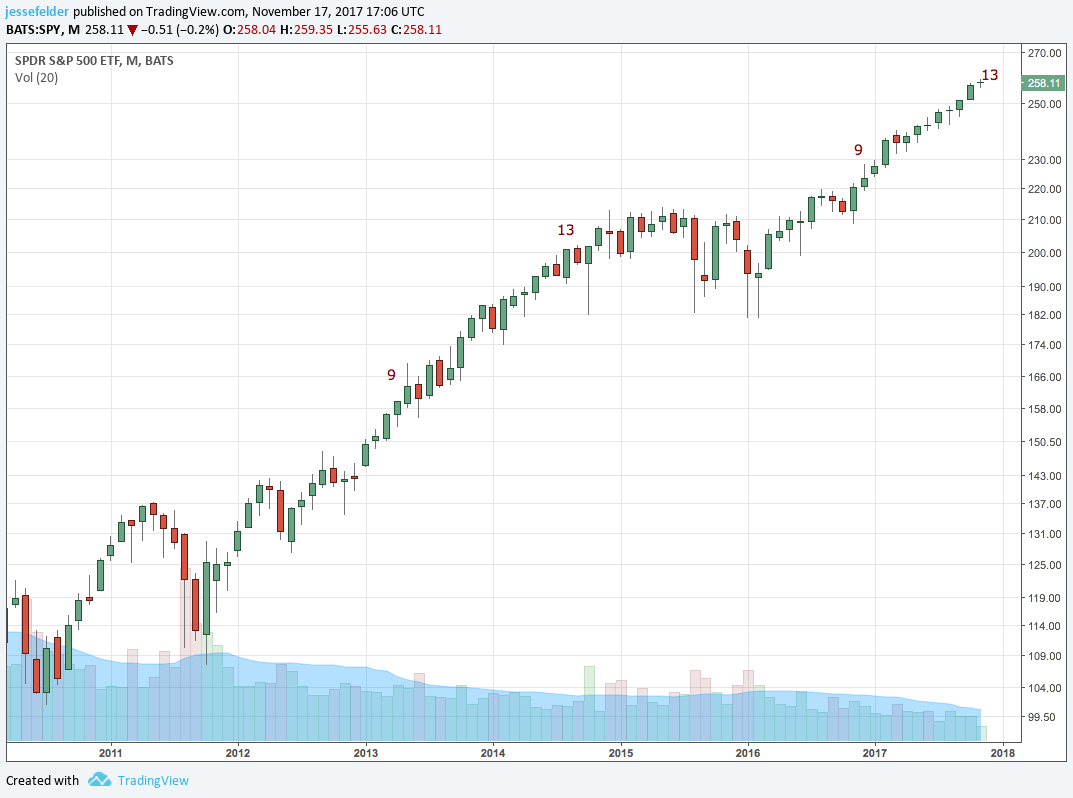
The monthly chart will likely trigger another 13 sell signal on December 1st (so long as it trades above 257.89).
Finally, a quarterly 9-13-9 sell signal was triggered on October 1st. This is a very rare alignment of sell signals across multiple time frames that suggests a high probability of a major peak being put in possibly this month or next.

Confirming the idea that we are nearing a major market peak is the large number of Hindenburg Omens that have triggered recently (as discussed in last week’s market comment). Over the past six months we have seen 23 omens triggered across the NYSE and NASDAQ, surpassing the total seen at the 2000 peak and matching that seen during the August-October period of 2007.

It will be very interesting to see how the rest of this month plays out. November is typically a strong month for the indexes. However, during both of those prior peaks mentioned above, November saw unusually large declines. SPY few 4% in November 2007.
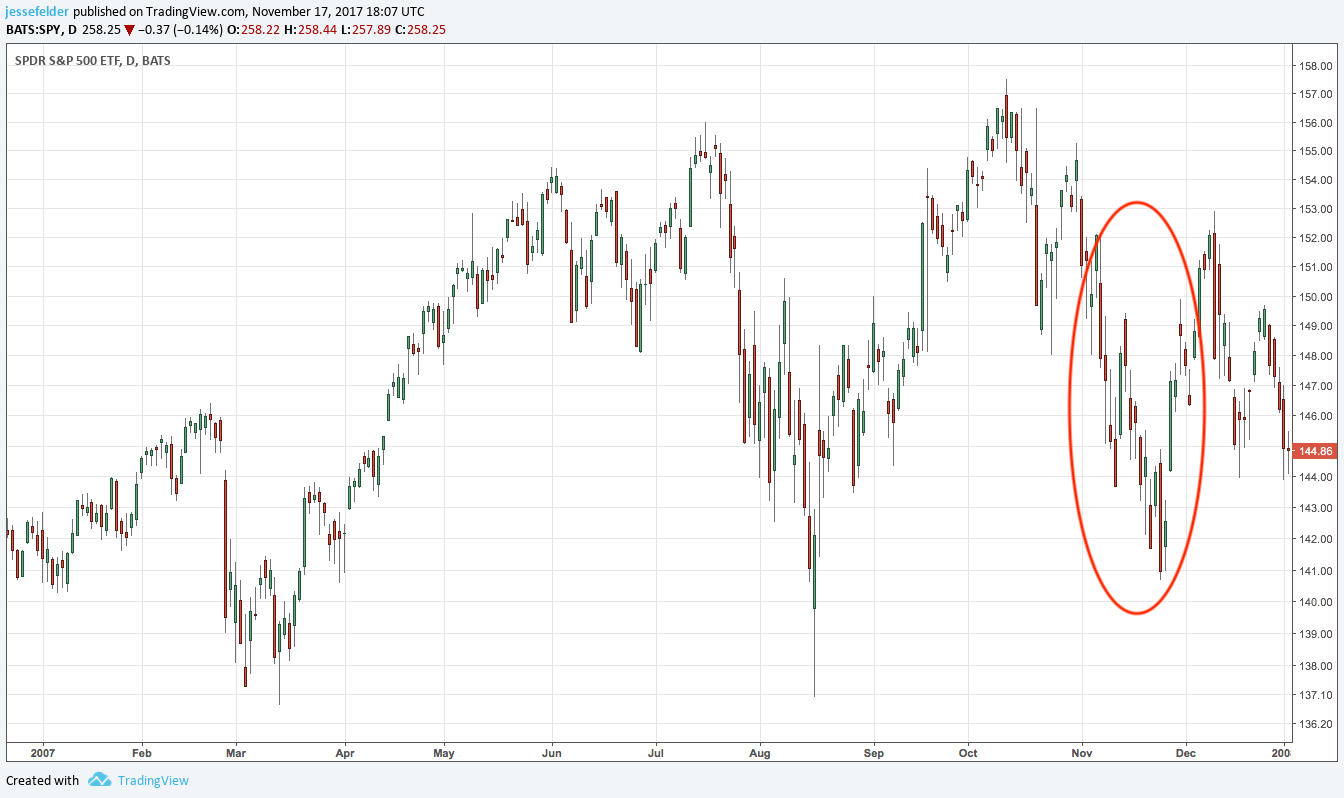
It fell 8% in November of 2000. Both of these uncharacteristic declines effectively signaled the start of those two major bear markets. If this November sees a similar decline (of at least 4%) it could have similar implications.
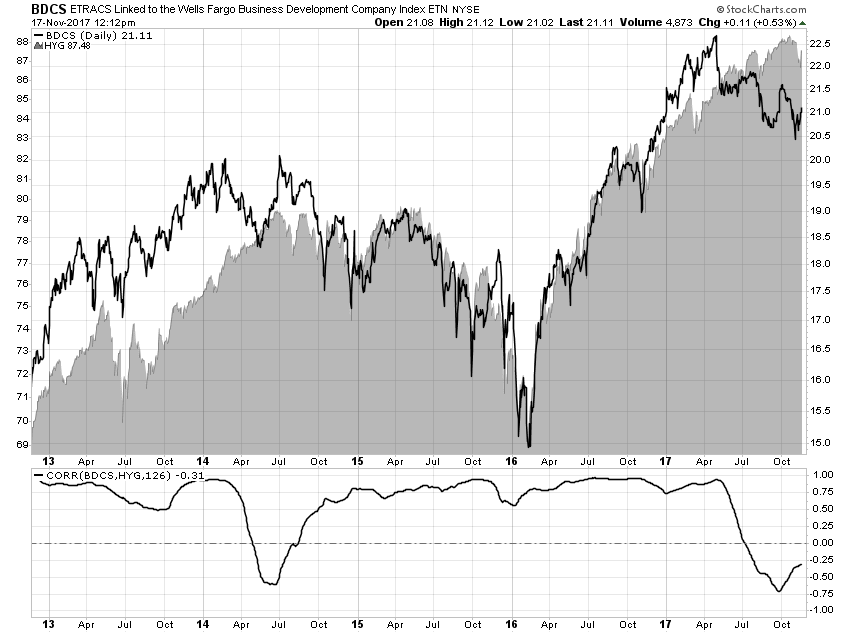
One thing that could trigger such a decline would be renewed weakness in the corporate credit markets. The recent action in business development companies (BDCs) could be a decent early warning sign here. If BDCs don’t recover soon (and I don’t think they will), it’s likely junk will follow them lower.
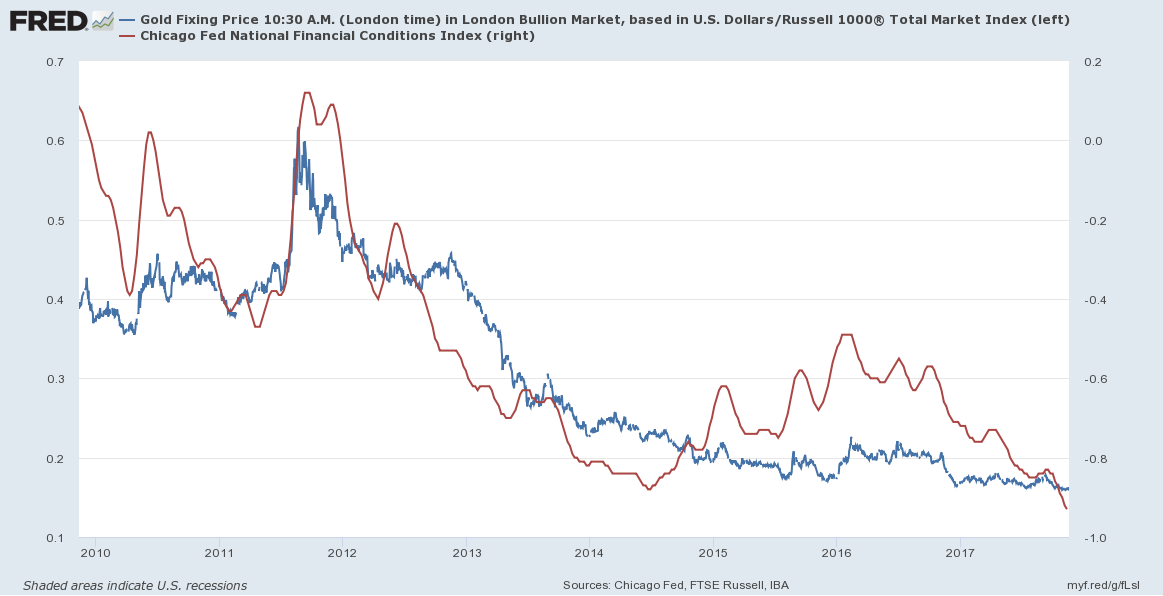
And a tightening of financial conditions would not only be problematic for risk assets, it would like be bullish for the gold price. The chart below (credit to Market Anthropology) shows the correlation between financial conditions (lower is looser/higher is tighter) and the gold/stocks ratio.
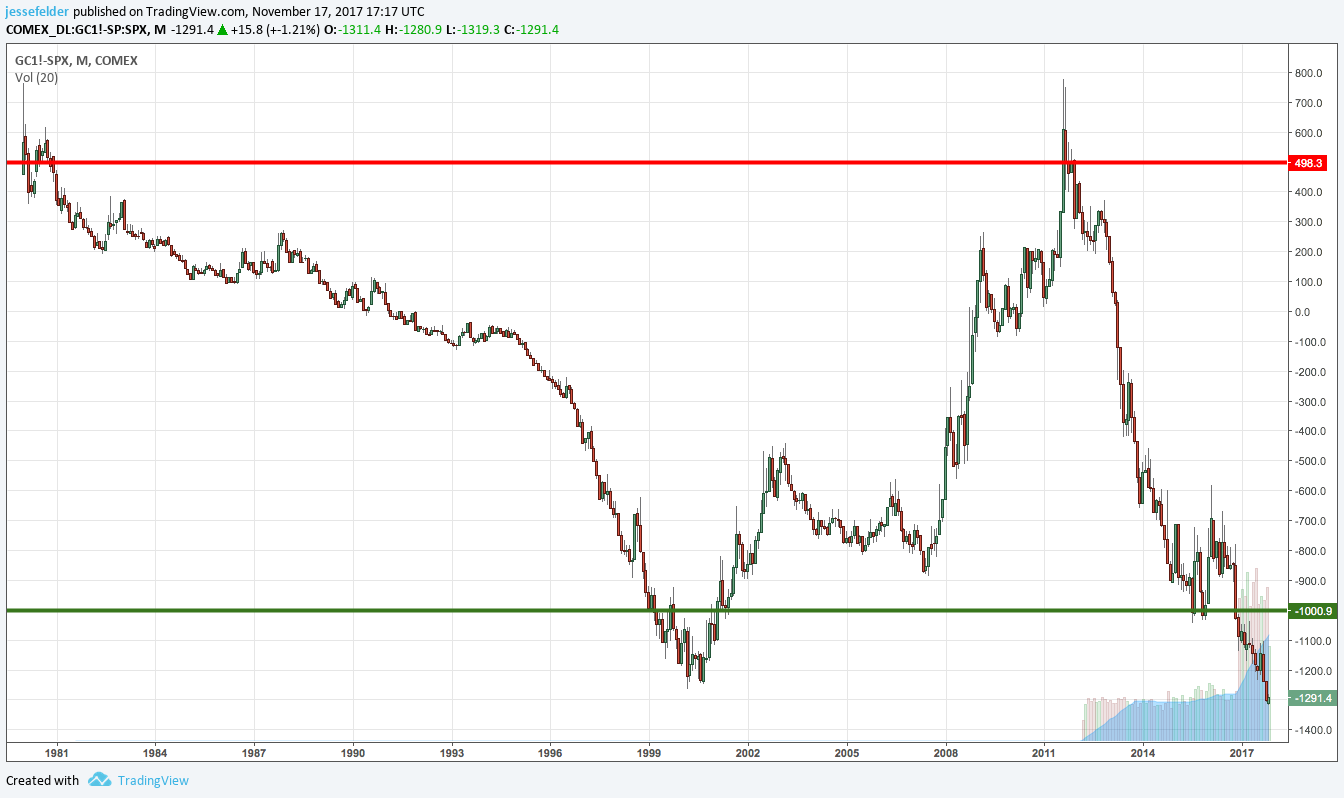
The difference between the gold price and the S&P 500 has now widened to a new record but it looks like it wants to snap back higher. Parity between these two is coming at some point and possibly very soon.
The gold price is, to some extent, just the inverse of the dollar (dollar/yen to an even greater extent). A long-term look at the dollar index shows a very clear topping pattern similar to what we saw in the early oughts. If this continues to play out, a new leg lower for the dollar index could begin shortly.
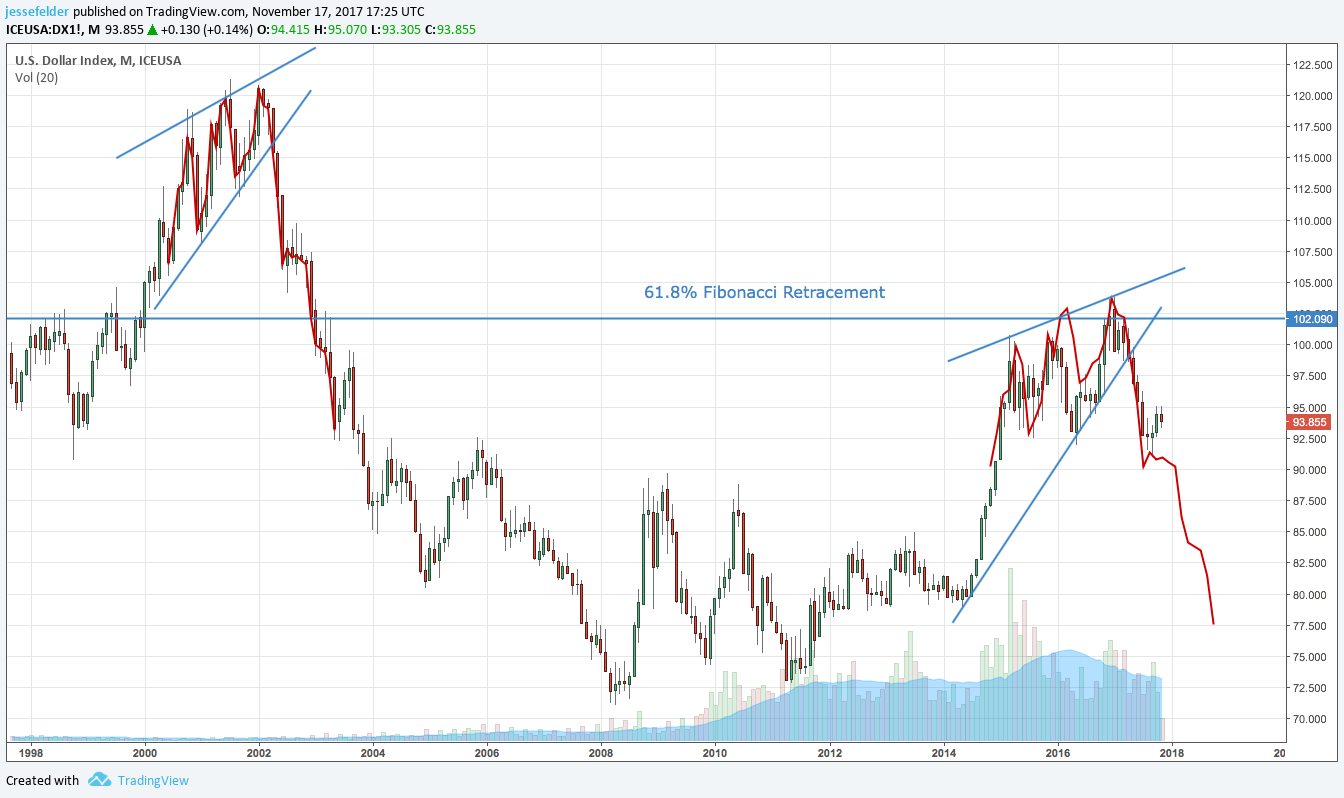
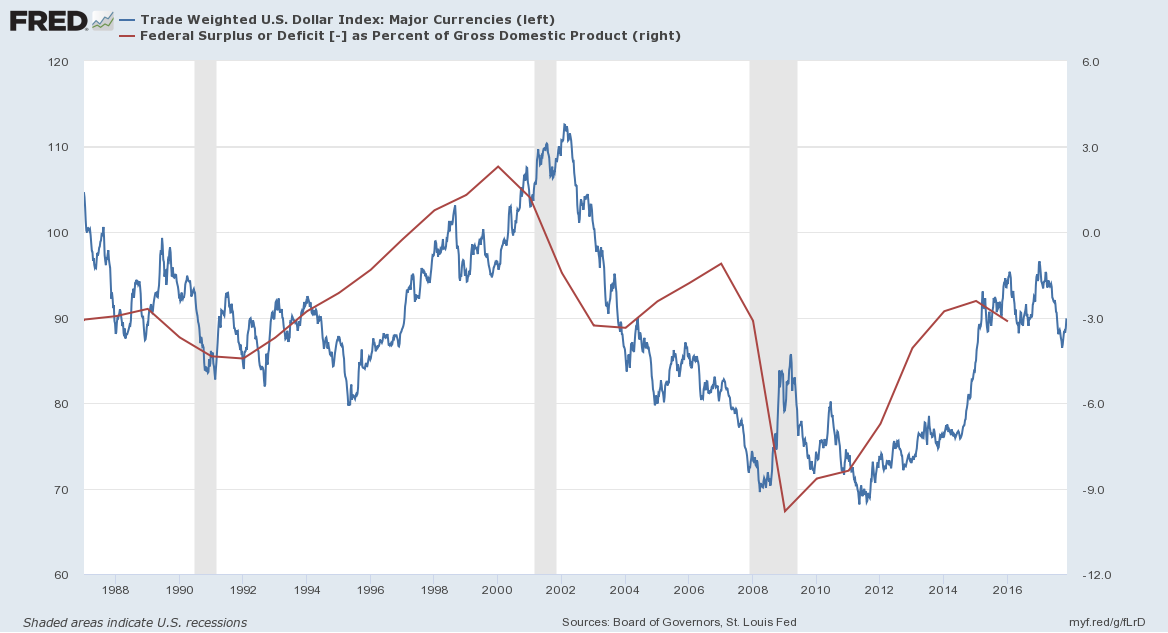
What would precipitate such weakness? How about a continued widening of the federal deficit. If any sort of tax cut at all is passed by congress this outcome is assured. Even without a tax cut, though, the deficit is already widening again, providing a strong tailwind for a new dollar bear market.
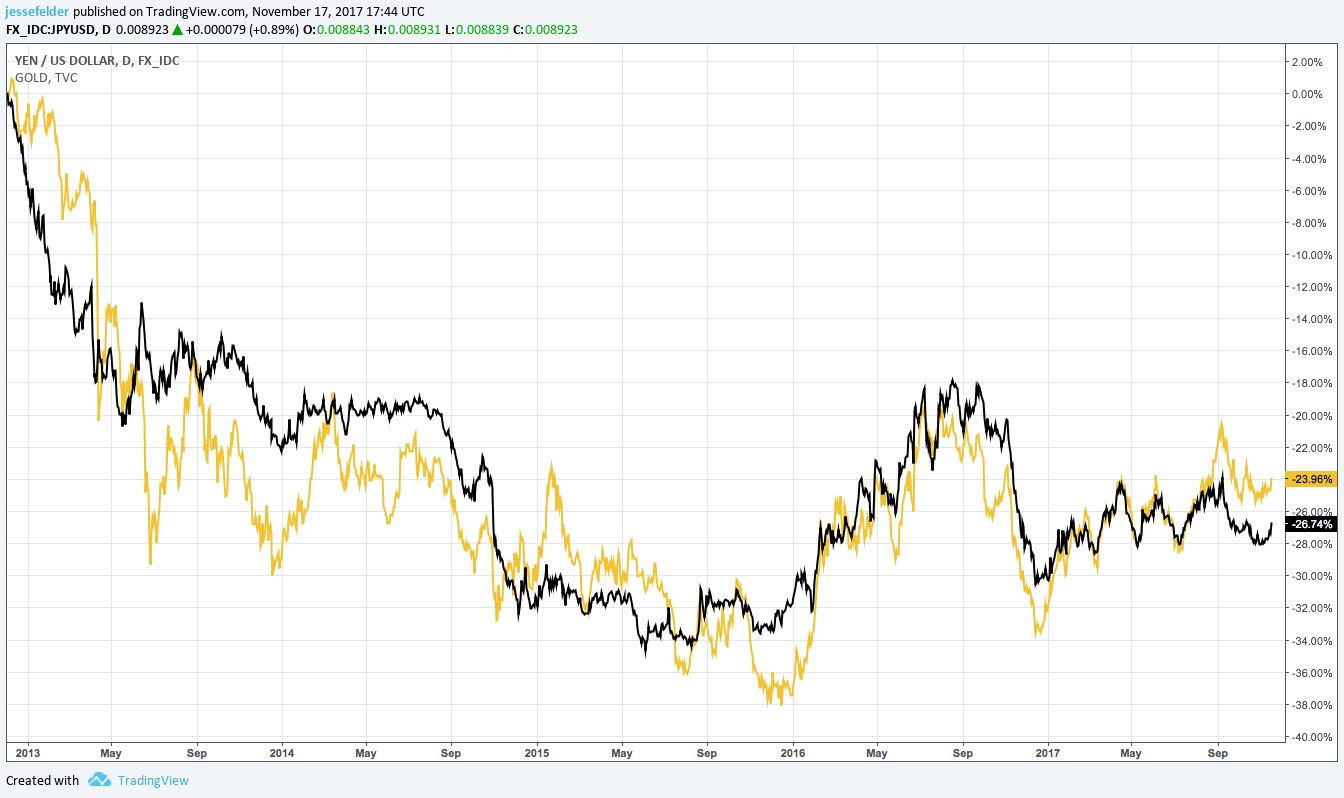
But, as mentioned above, it’s the Japanese yen versus the dollar that really matters most to the gold price.
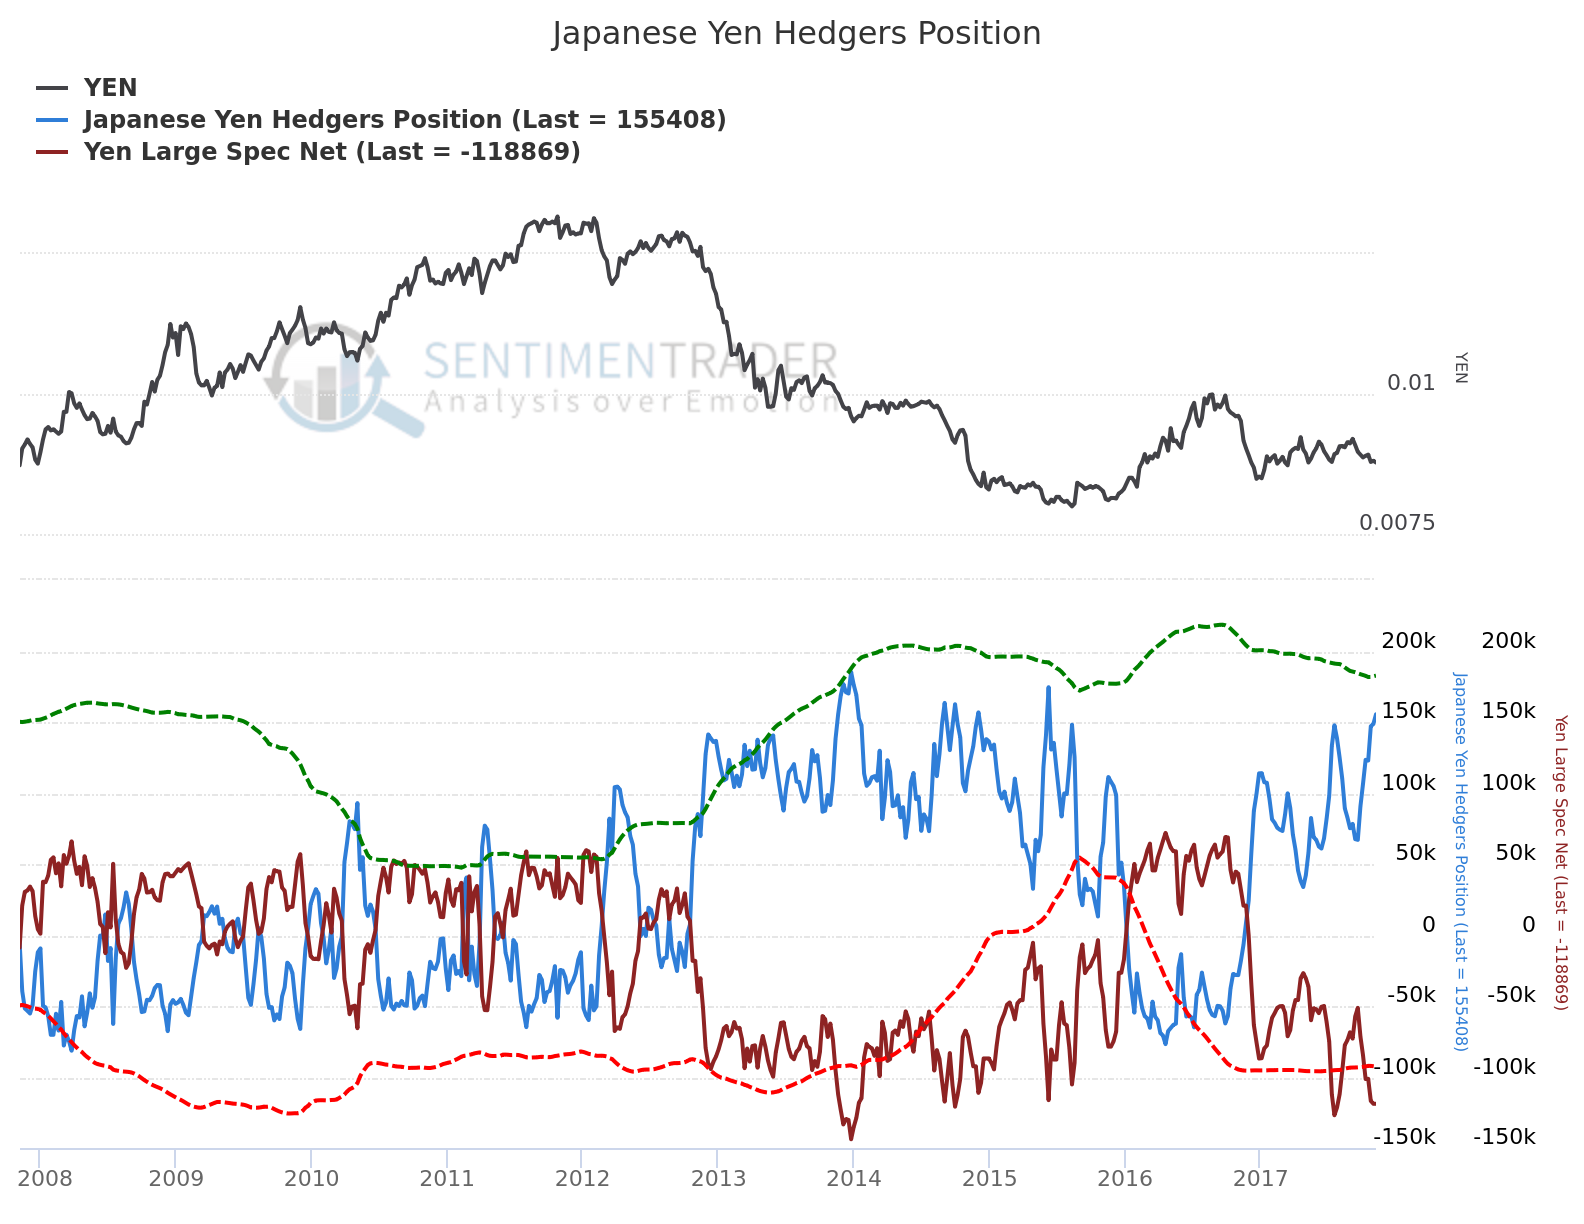
Here, commercial hedgers (smart money) have moved back to their largest net long position since the 2015 lows while speculators (dumb money) have moved back to one of the largest short positions in history. This could be a recipe for a major yen pop to the upside in the short run.
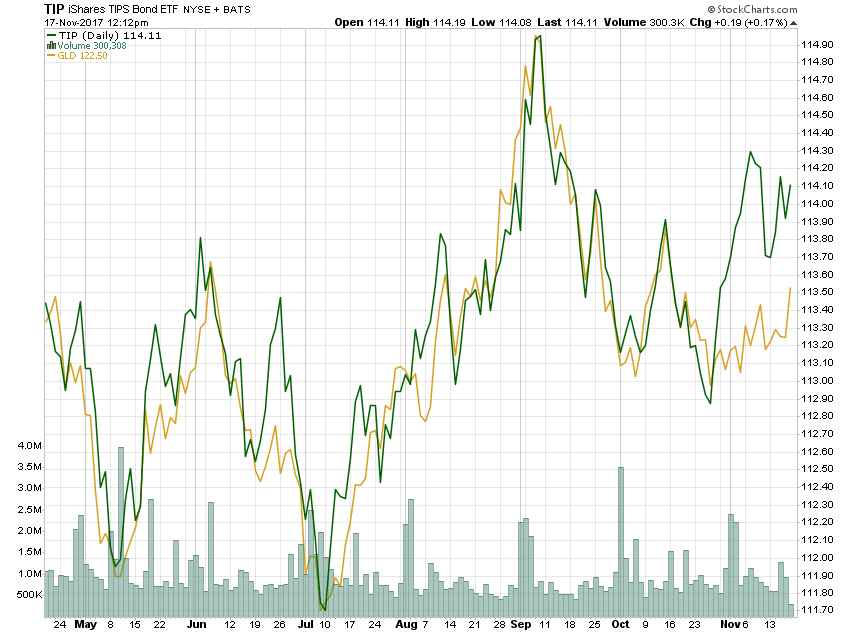
While a burst higher in the yen would be bullish for gold, it also looks like it has to catching up to do with TIPS to the upside, as well.
Either one of these bullish catalysts could help to confirm the message from our 2008-2009 analog for the gold price (hat tip, @ECantoni). It shows that another move up to the $1,325 area could happen at any time.
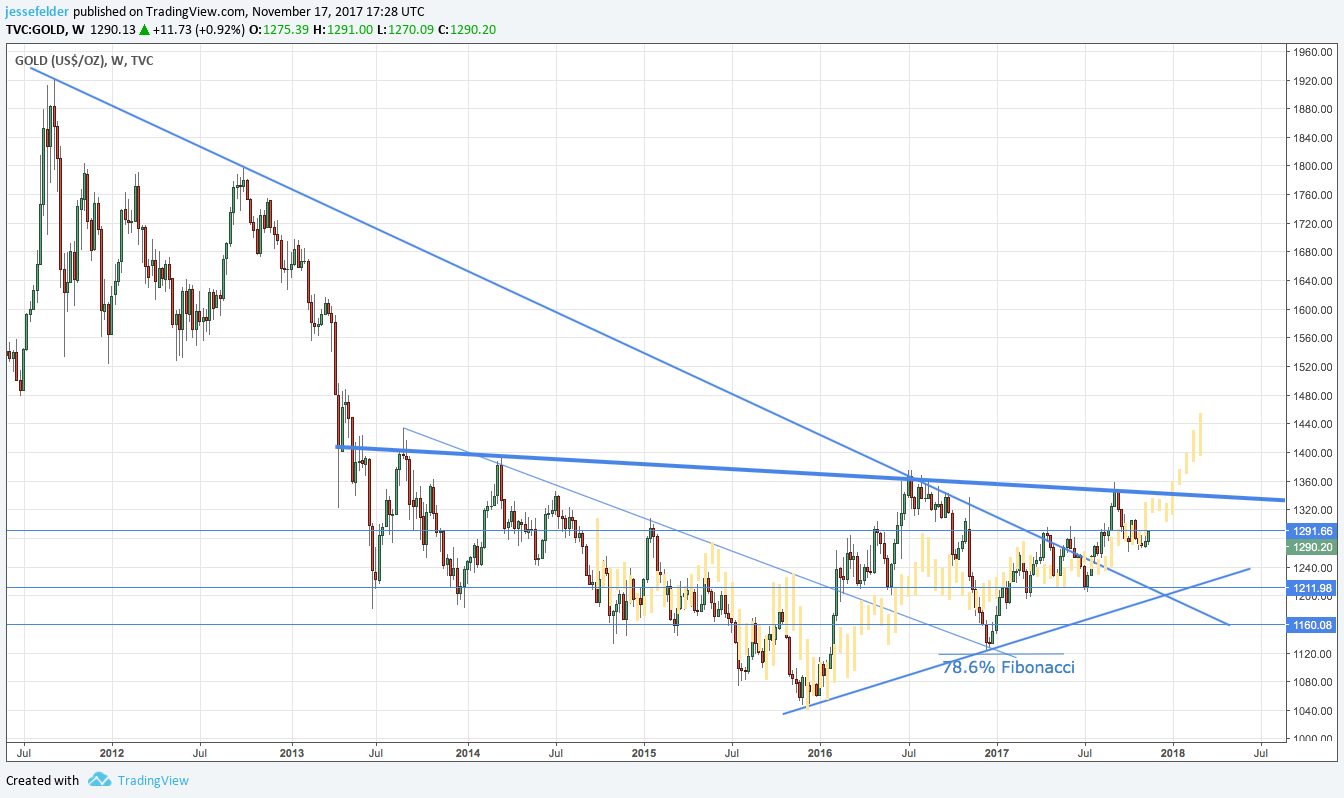
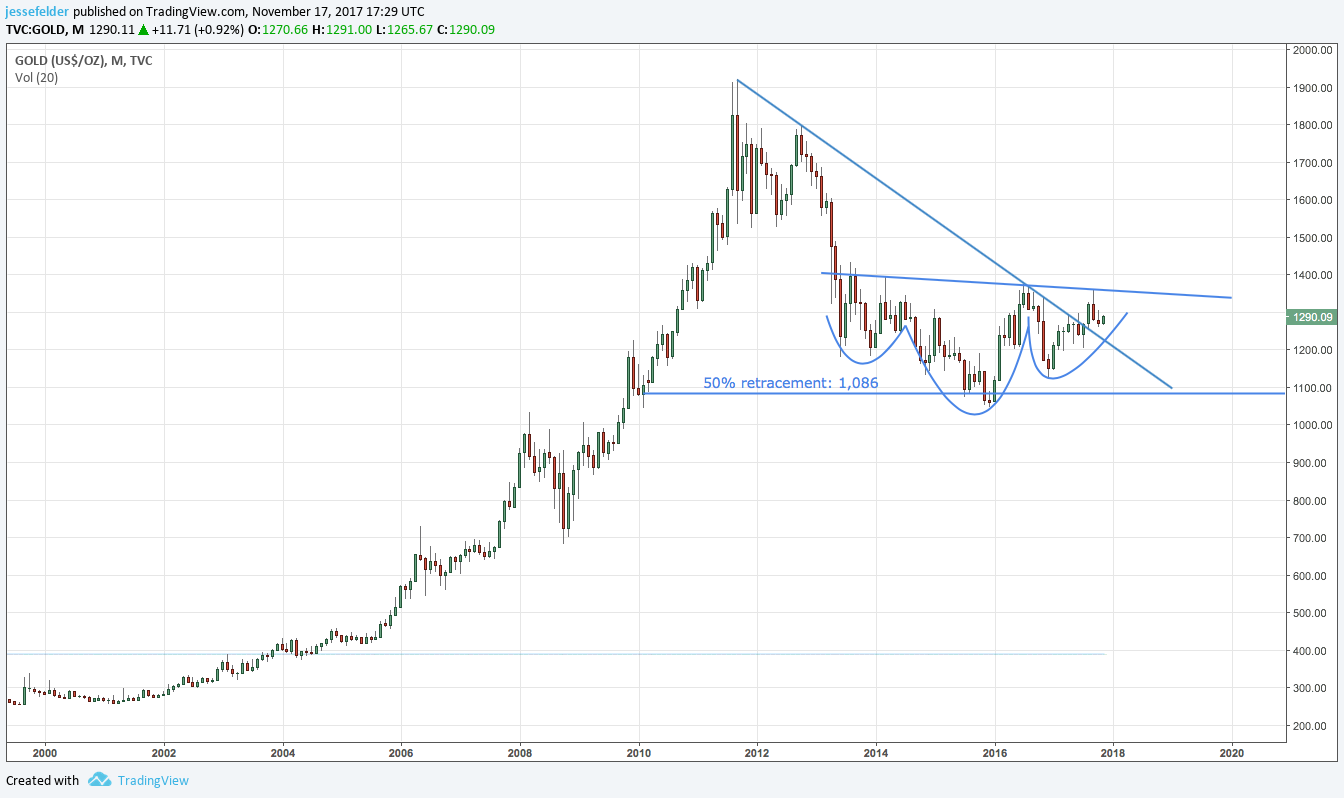
Longer-term, it’s pretty clear that gold has broken its long-term downtrend and formed a bullish head and shoulders bottom pattern in the process. A break above $1,350 would complete the pattern and project a target of about $1,650.
And a major peak for stocks accompanied by a new bull market in gold might be just what the doctor ordered to kick off a much needed, major mean reversion between the two.