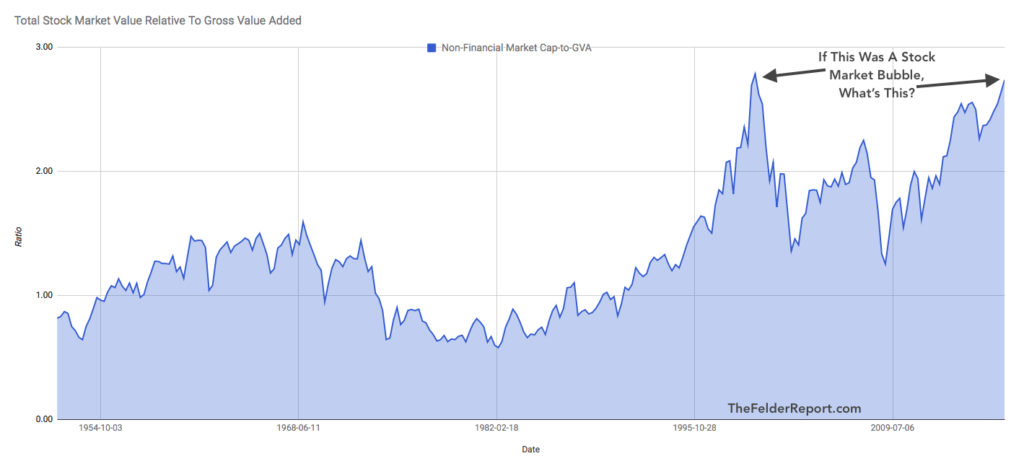
My friend, Dr. John Hussman, recently pointed out that stocks have now achieved a valuation altitude that is extremely rare. Only during the week of March 24, 2000, the very peak of the dotcom mania, were stocks ever more highly valued than they are today. As another friend of mine, Eric Cinnamond, recently asked, “If valuations are similar or higher than past bubble peaks, how can today’s cycle not be considered a bubble?” Good question.
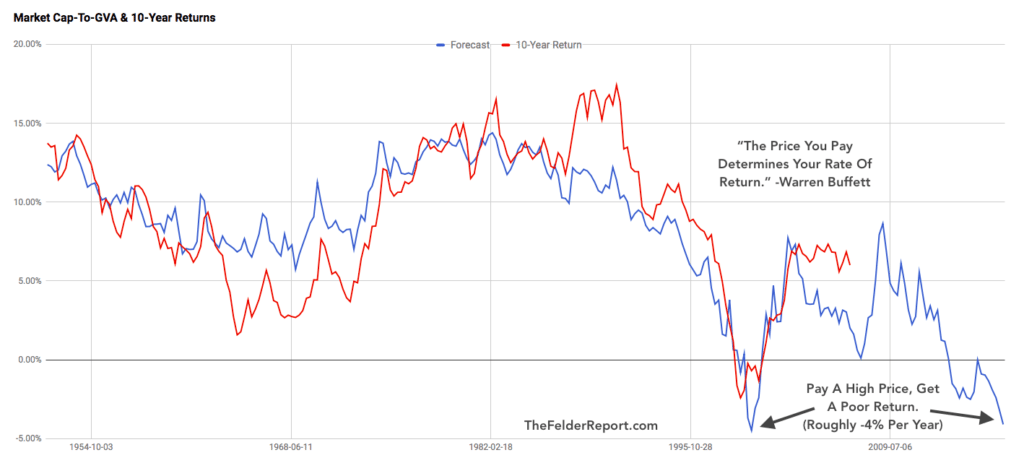
 The chart above plots the total market capitalization of non-financial equities relative to their gross value added. It’s a very similar measure to the Buffett Yardstick (market cap-to-GDP). Dr. Hussman developed this one as it addresses a key criticism of Buffett’s favorite valuation tool. That is it doesn’t include foreign revenues generated by domestic corporations. This measure does. What is so valuable about both is that they have a very high negative correlation with future 10-year returns in the stock market. In other words, they accurately demonstrate that, in the words of Mr. Buffett himself, “the price you pay determines your rate of return.” Right now this measure suggests investors are facing another lost decade just like the one that followed the last major stock market bubble.
 Many, including Mr. Buffett, have argued that low interest rates justify high stock prices. This argument is based upon something called the “Fed Model” that compares the earnings yield from the equity market to the nominal 10-year treasury yield. The trouble with this line of thinking is that when you lower your discount rate for valuation purposes in this way as nominal yields fall, you must also lower your earnings growth rate because corporate earnings are very highly correlated to inflation and interest rates. Doing the former without the latter is either very naive or just plain disingenuous.
The Fed, who explicitly does not endorse this valuation model named for it, gives us another way to think about it:
Many authors, including Ritter and Warr (2002) and Asness (2003), have pointed out that the practice of comparing a real number like the E/P ratio to a nominal yield does not make sense. While it would be more correct to compare the E/P ratio to a real bond yield, that comparison still ignores the different risk characteristics of stocks versus bonds and the reality that, over the past four decades, cash distributions to shareholders in the form of dividends have averaged only about 50% of earnings.
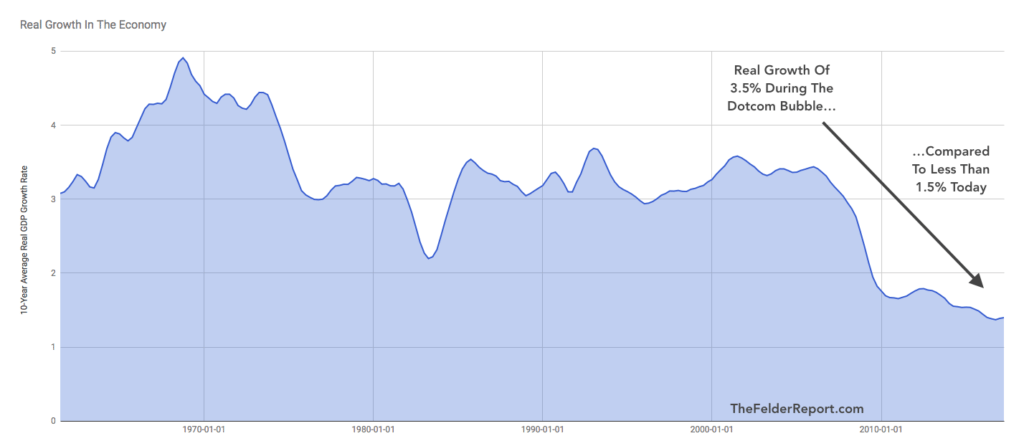
Still, this is a mistake investors seem all too willing to make, especially when it is endorsed by the likes of none other than Warren Buffett. On the other hand, Howard Marks actually makes just the opposite case. He recently wrote, “it can be argued that even the normal historic valuations aren’t merited, since economic growth may be slower in the coming years than it was in the post-World War II period when those norms were established.” In fact, growth rates have remained relatively steady in post-WWII period until very recently. They have fallen dramatically in just the decade since the dotcom mania.
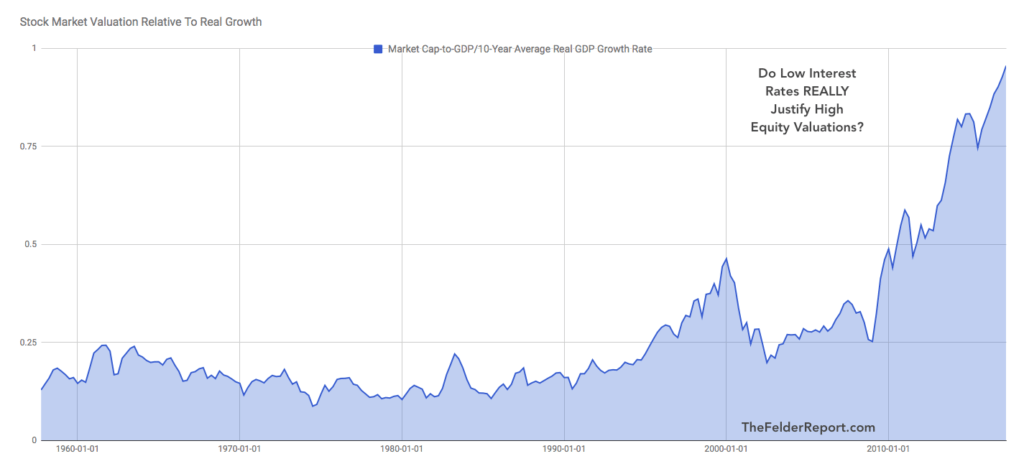
 In this light, it’s not difficult to argue that stocks are even more overvalued today than they were during the dotcom mania simply because underlying real growth is much slower today than it was back then. And when we take the Buffett Yardstick and compare equity valuations to the underlying real growth rate this becomes glaringly obvious. That bump back in 2000 that represents the dotcom mania is dwarfed by the surge we have seen in recent years.
 The bottom line is this: If you believe that equity valuations should reflect their underlying growth potential than this chart should worry you. If not, I wish you the best of luck while simply noting this sort of “new era” thinking is the hallmark of a financial bubble.

