1/5/17
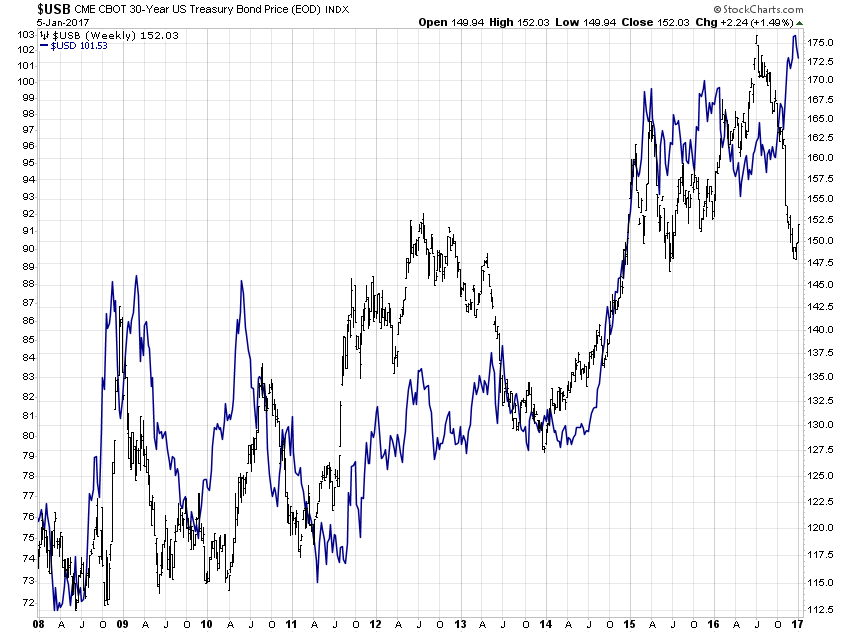
Yesterday we looked at the dollar. Today I’d like to revisit stocks and bonds. But first, looking at the dollar and bonds together, a sustained drop in the former would go a long way toward closing the gap in the chart below. While bonds rallied nicely today, doing their part, I think the dollar will do more than its fair share here.
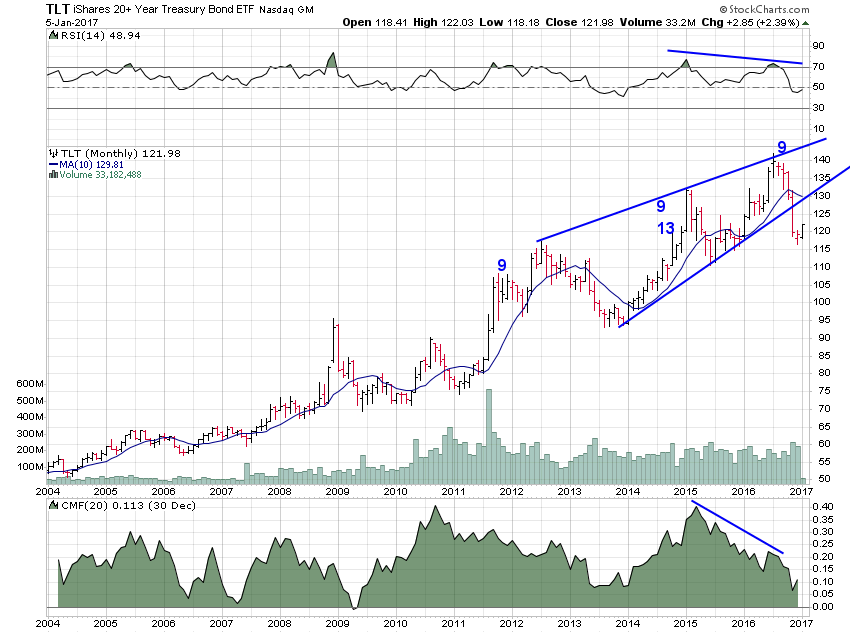
The recent move in bonds strikes me as an impulsive move, a clear signal of a trend change, rather than just another correction in an ongoing bull market. The reasons for this are several. The price action was swift and came right on the heels of some incredible euphoria, exactly the kind of stuff that Sir John Templeton tells us marks the end of a bull market. It also came amid a number of exhaustion signals across multiple time frames and within the context of an ending diagonal. I wouldn’t be surprised to see TLT test that lower trend line from below but that would probably just mark a great opportunity to sell.
Another reason I think there is a good chance the uptrend has ended for bonds is the rising spectre of inflation.
Prices Are Rising Across the Globe. That's a Good Thing, Right? https://t.co/k3aMRvp2NS pic.twitter.com/Z8D0GHvZZL
— Jesse Felder (@jessefelder) January 5, 2017
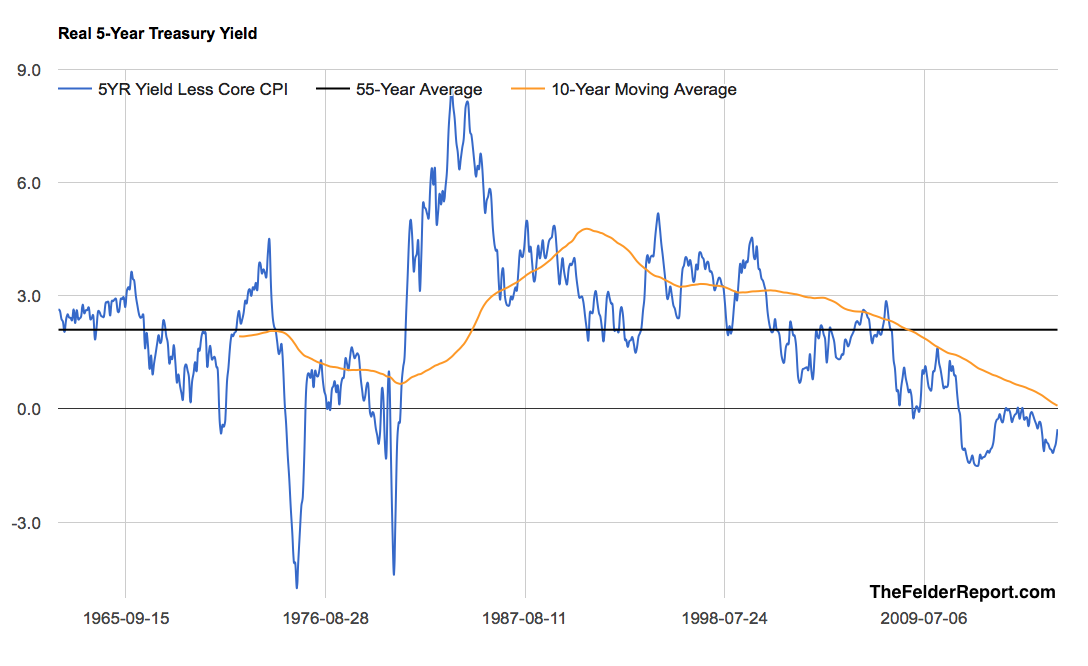
Below is the 5-year Treasury yield less core CPI. Notice that the 10-year moving average of the real yield (orange line) is the lowest in over 50 years. In other words, this bond has not been more expensive than it is today in at least a half century. If inflation is coming back, bonds have a very long way to go in order to appropriately compensate investors for that risk. The average yield above inflation over this time has been about 2%. This would mean the 5-year Treasury needs to yield 4.5% in order to reflect an historically adequate inflation premium before inflation even begins to rise! It yields less than 2% today.
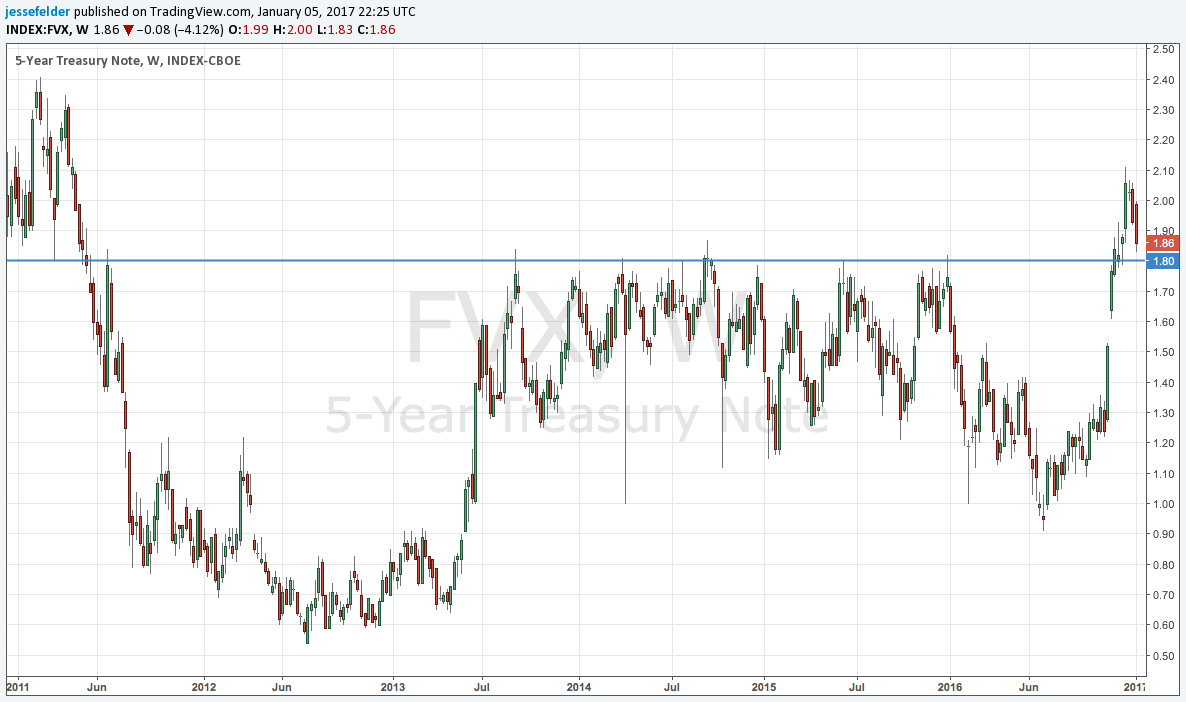
 Taking a look at the 5-year yield, this chart just looks like a classic breakout above horizontal resistance followed by a test of the breakout level. In other words, the rally in bonds over the past week or so is more likely to be a bull trap than a renewal of the uptrend.
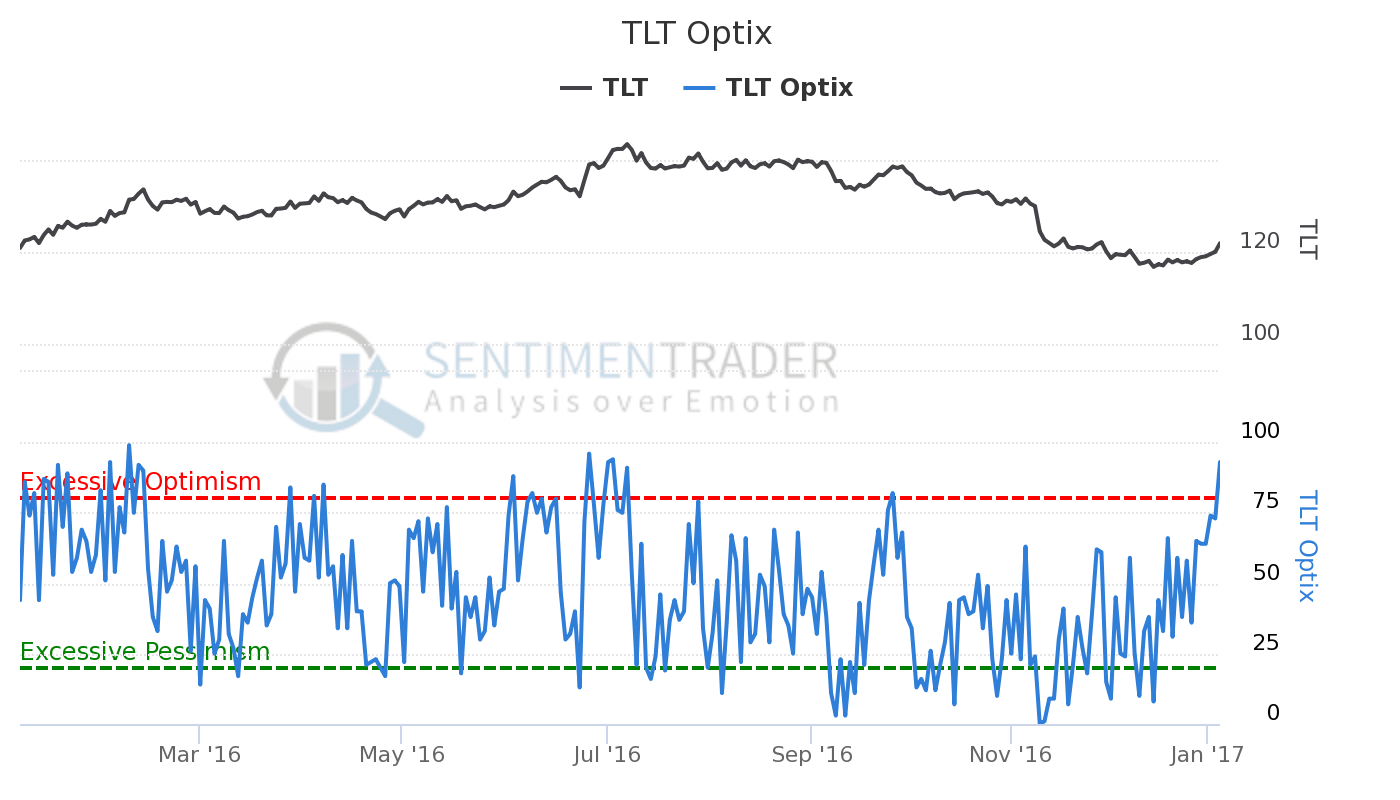
Sentiment confirms this view. Traders have turned very optimistic about bonds finding a bottom right now. If I were bullish I would prefer to see some skepticism toward the rally.
Furthermore, our 1994 bond market analog continues to play out according to script. Should we continue to follow this story line it suggests that the lows are still ahead of us.
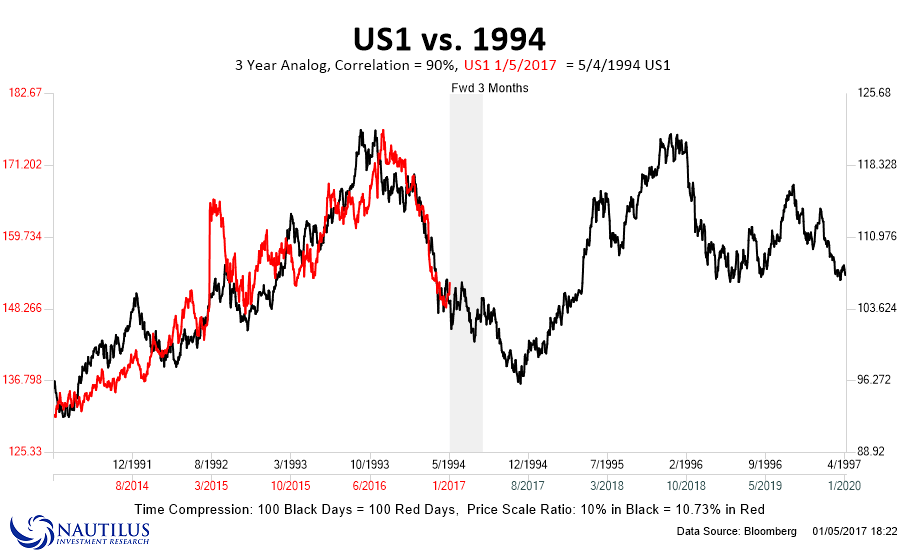
And if that’s the case, then risk assets will have to start to come under pressure. The 1994 period in bonds is matched very nicely with the same period for the Nasdaq 100. Stocks didn’t react well to rising risk-free returns back then and there’s no reason they should react any different today.
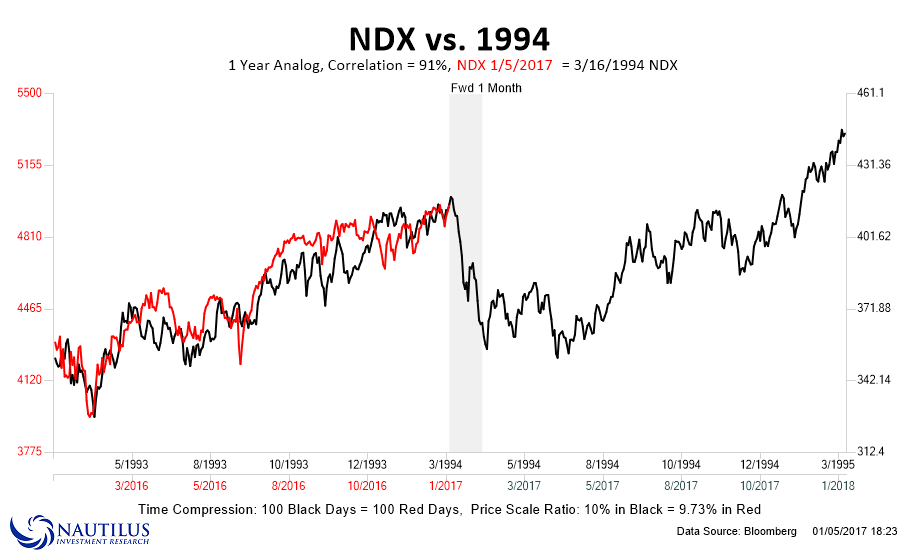
In fact, considering the increased leverage employed in the bond market today, you could easily make the case that risk assets are more at risk today than they were back then.
Just look at bond fund leverage and sensitivity to U.S. benchmark (via IMF) @jessefelder https://t.co/o51HoHW7Ja pic.twitter.com/iD3SVAyYqo
— Αarοn Chan (@macrodidact) January 4, 2017
And it’s not just the 1994 episode that is instructive here. Rapidly rising yields have always been disruptive to financial markets in one way or another.

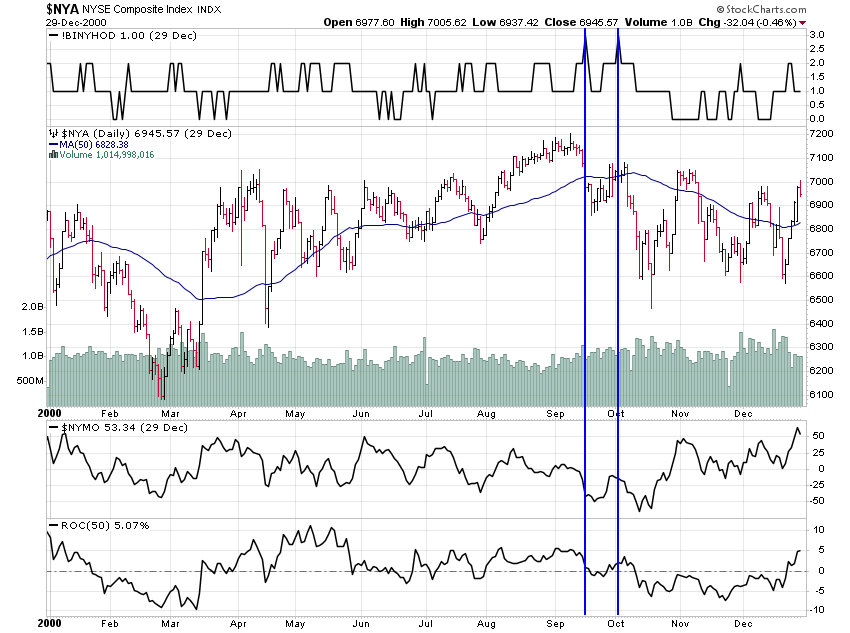
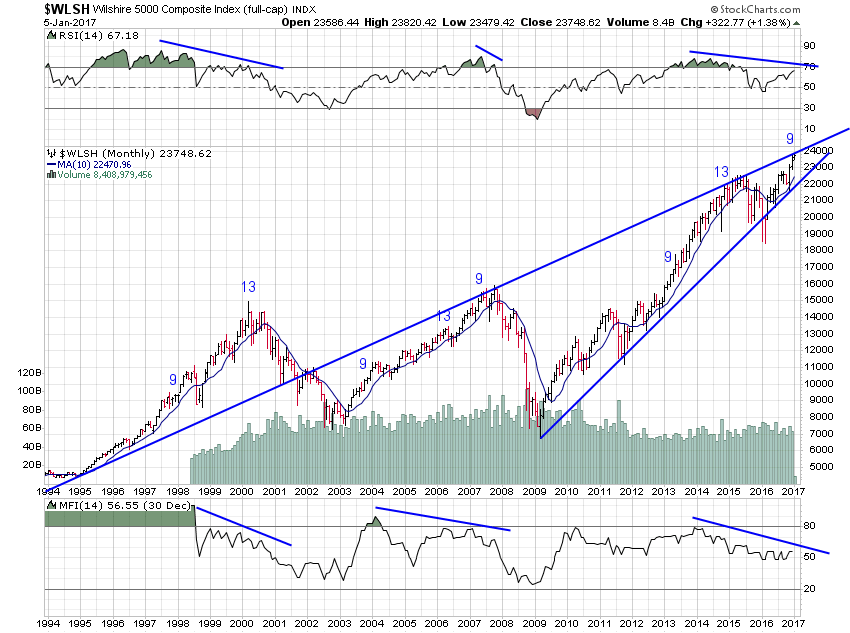
I believe this is the exact message behind the pair of Hindenburg Omen’s we witnessed last month.
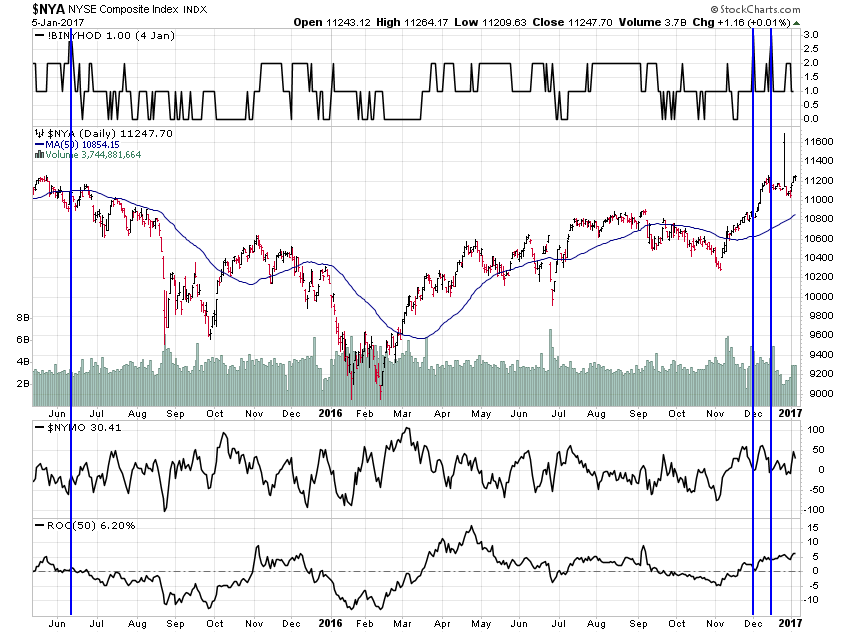
Again, this is very similar to what we saw in late-2000 as the NYSE Composite was putting in its final bull market top.
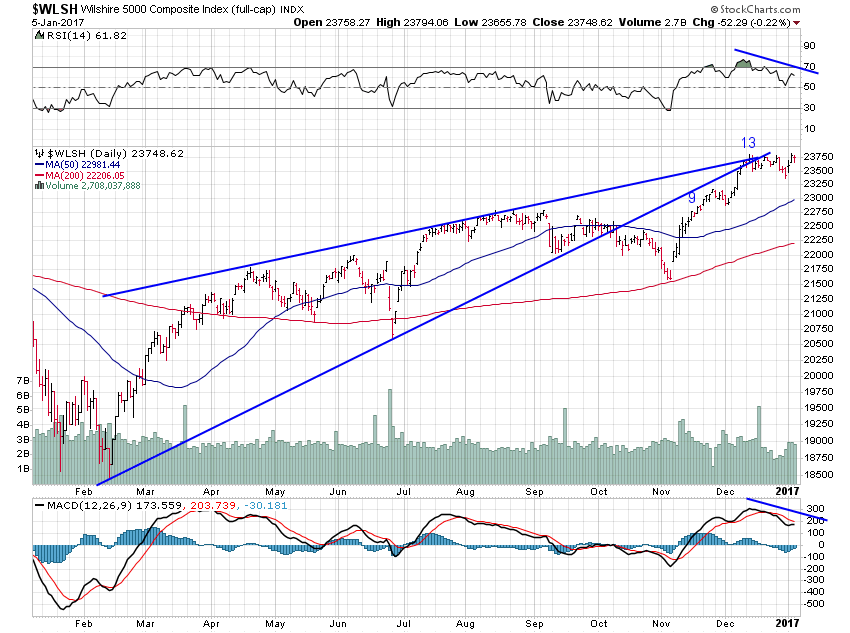
Technically, it looks like we are now seeing in stocks some very similar action to that we saw in bonds last summer. That is, euphoria accompanied by exhaustion signals on multiple time frames and amid bearish reversal patterns.
It appears that it’s not only the uptrend in the dollar that looks ripe for reversal.
1/4/17
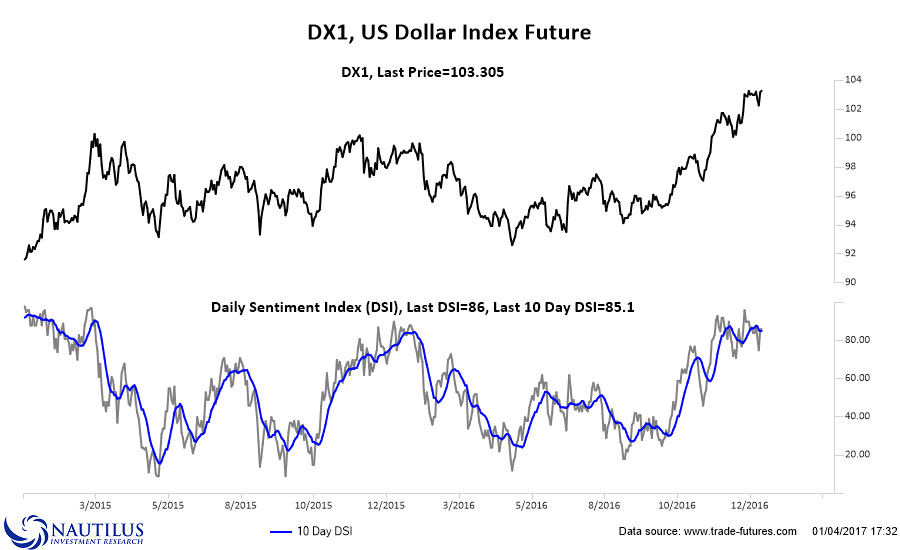
Over the past several weeks I’ve been looking for signs that the dollar was putting in a major top. Fundamentally, the dollar is very overvalued (in terms of “purchasing power parity”), especially against the euro, yen and the pound. Gavekal noted recently that the overvaluation relative to the latter is about as great as it has ever been. Interestingly, the last time it was so overvalued was during Reagan’s presidency, another echo to that era that so many have been discussing.
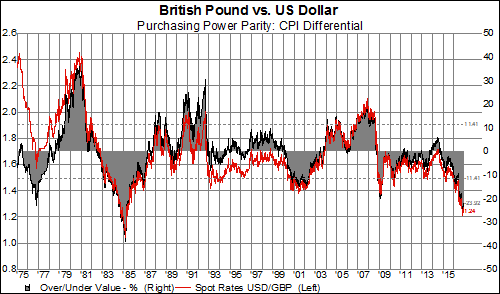
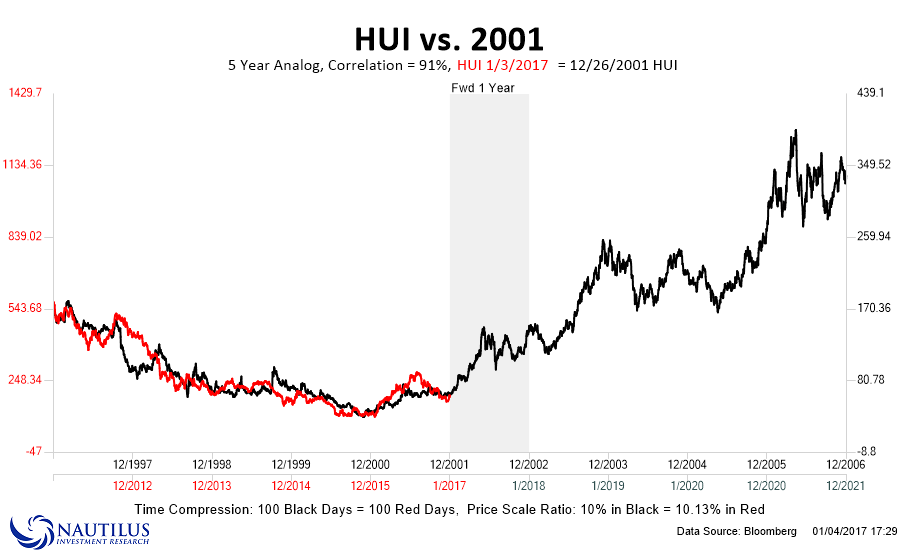
If you look at the prior times the dollar was so overvalued you’ll notice another era I have been discussing. Not only does the dollar’s overvaluation today echo its overvaluation during the early 2000’s, so does its price action. That 5-year analog has a pretty close fit with our recent experience.

And, as Peter Brandt pointed out on twitter today, the euro versus the dollar is now staring at long-term support along with an interesting timing cycle dating back to both of those prior periods of dollar overvaluation. This suggests another bullish reversal for the euro/bearish reversal in the dollar could be in the cards.
Chart from @NautilusCap – a service I greatly respect – supports idea of Jan Effect low for $EURUSD pic.twitter.com/XYIBfc1s3h
— Peter Brandt (@PeterLBrandt) January 4, 2017
Technically, the recent rally looks ripe for just this sort of reversal. Momentum indicators are diverging from the new highs in price just as they test the 61.8% Fibonacci retracement of the major decline since this last major price high was put in.
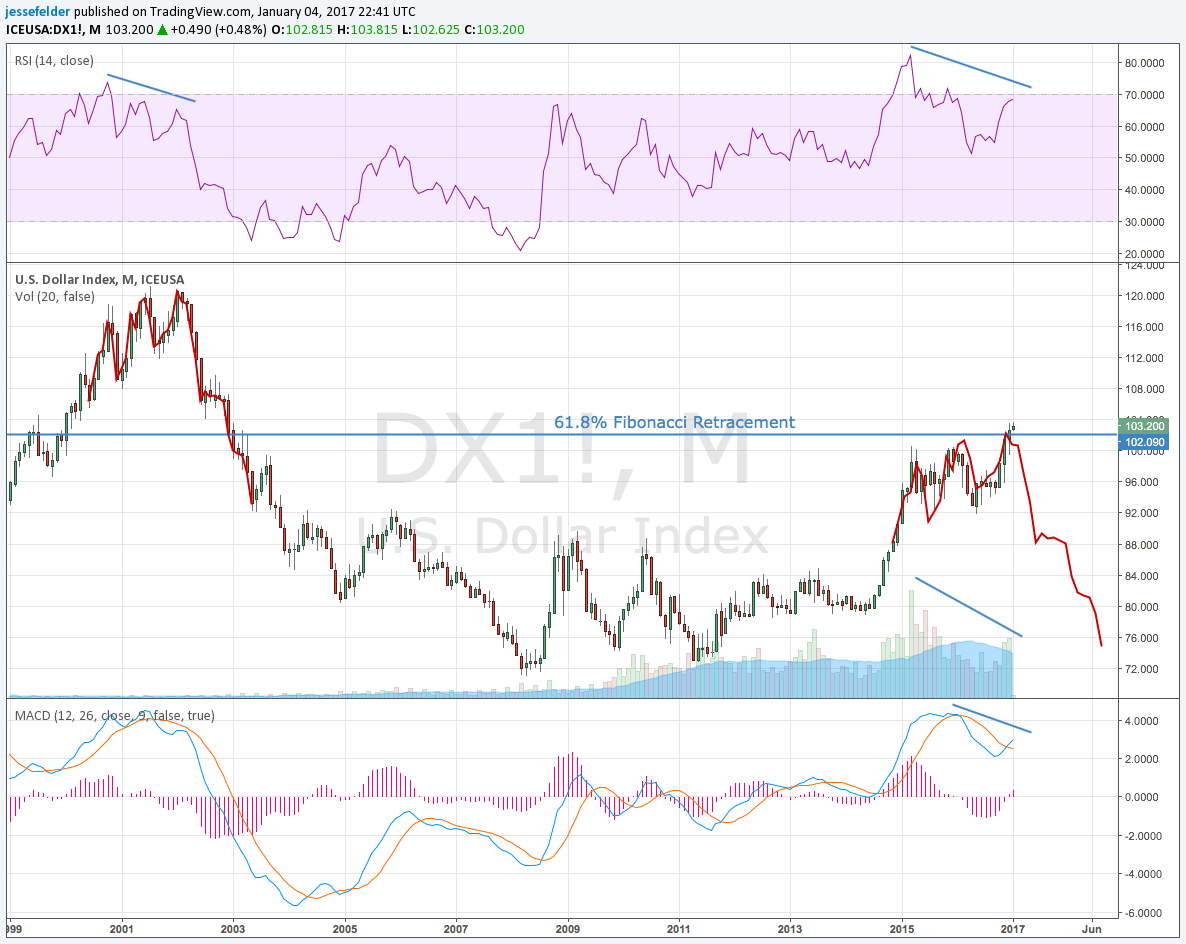
Short-term technicals are now starting to confirm this long-term view, as well. Should the dollar convincingly break down out of its bearish wedge pattern it could quickly retrace its entire move higher since the election.
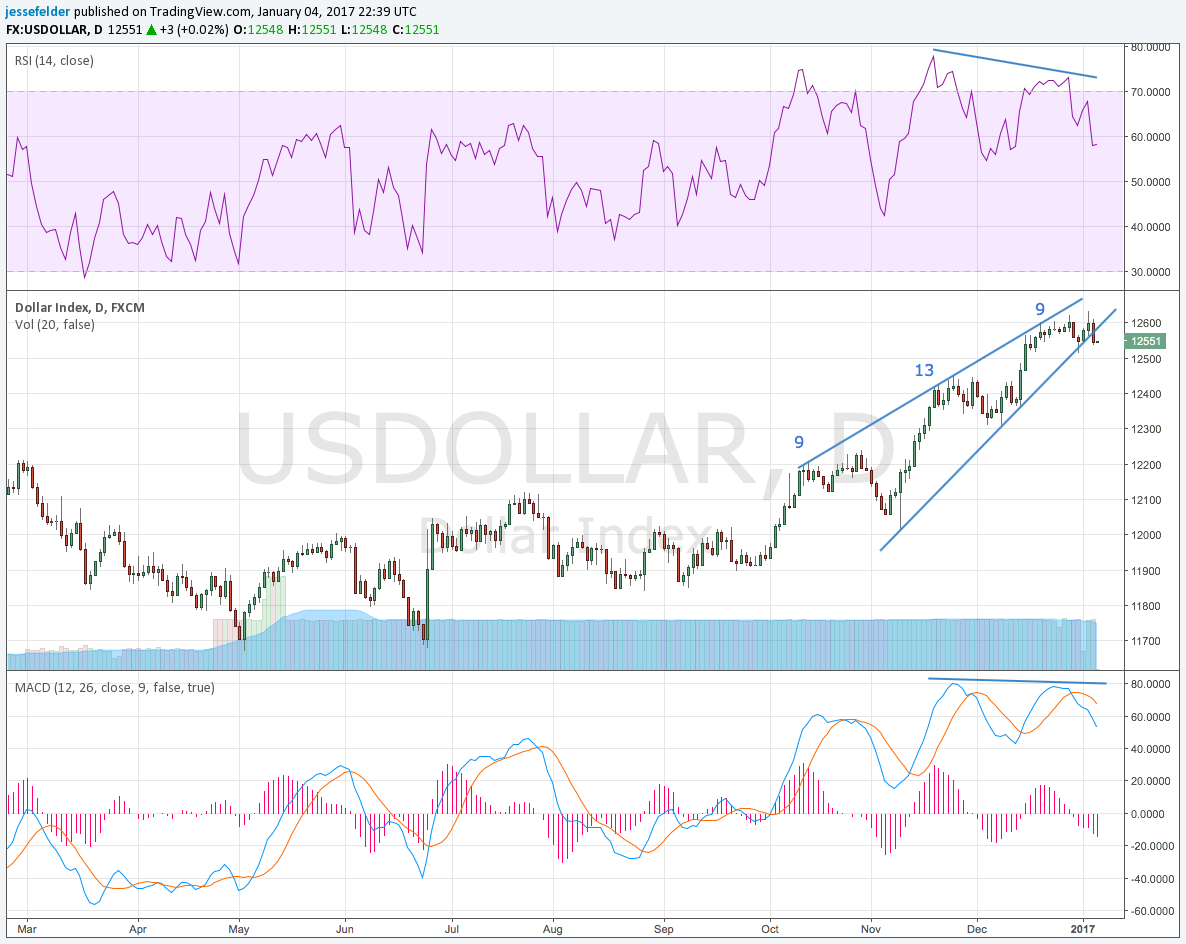
This would also nullify the recent breakout to new highs that has gotten so many so bullish toward the greenback. The Daily Sentiment Index currently shows 86% bulls, the most since early last year as the dollar was starting to roll over.
All of this would suggest that gold could be in the process of putting in another important bottom. Recently, it looks like that’s exactly how it is reacting.

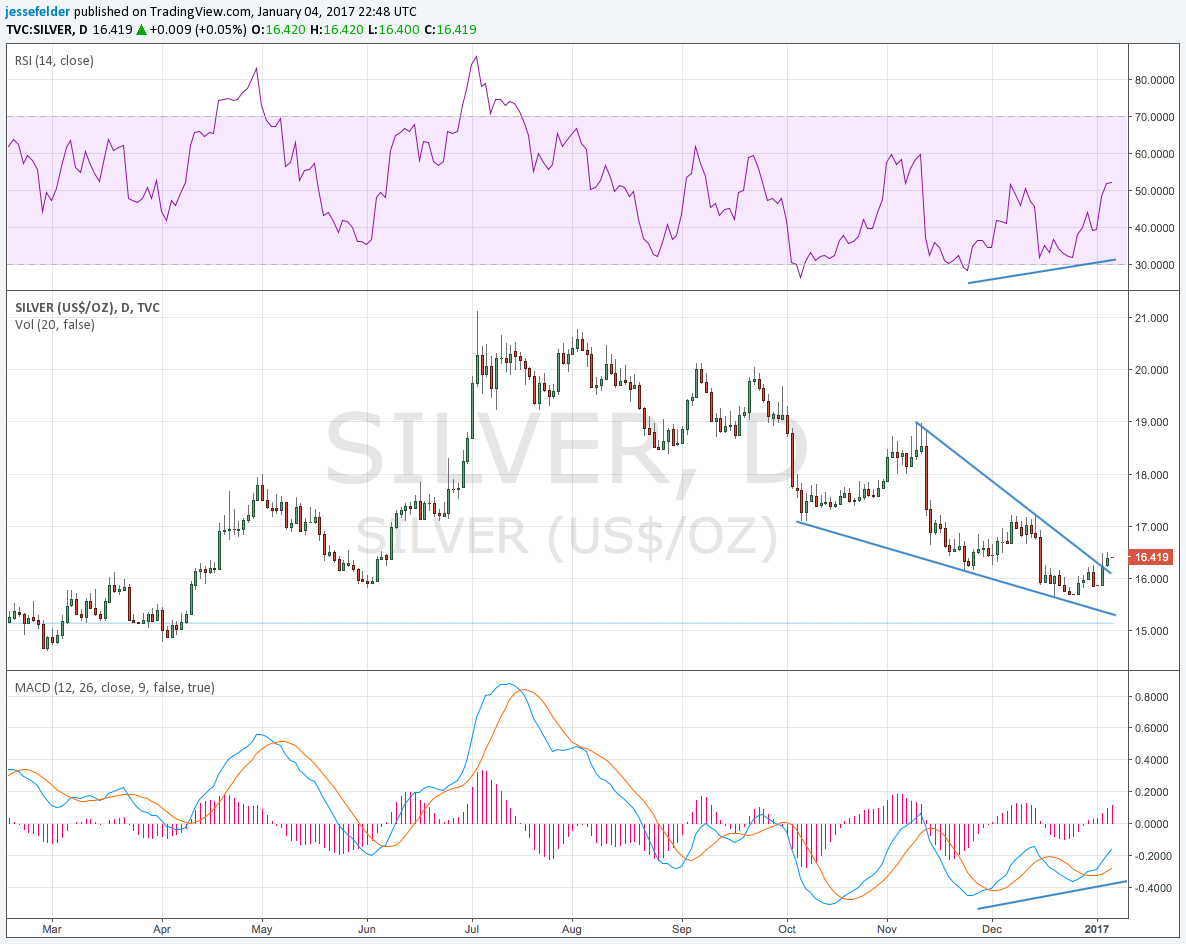
Silver also seems to be trying to break up out of its bearish wedge just as the dollar breaks down out of its bearish one.
Longer-term, this would be an almost ideal place for gold to bottom out as it tests the breakout of its intermediate-term downtrend line. I would note that the major downtrend line is still in tact but this recent selloff looks to me like the mirror image of the late-2012 rally. Back then, gold bugs clearly thought the major uptrend would resume and they embraced it wholeheartedly (as evidenced by the CMF at the bottom of the chart). This time, investors have been convinced that gold’s downtrend has resumed and they have thus sold into this decline very heavily.

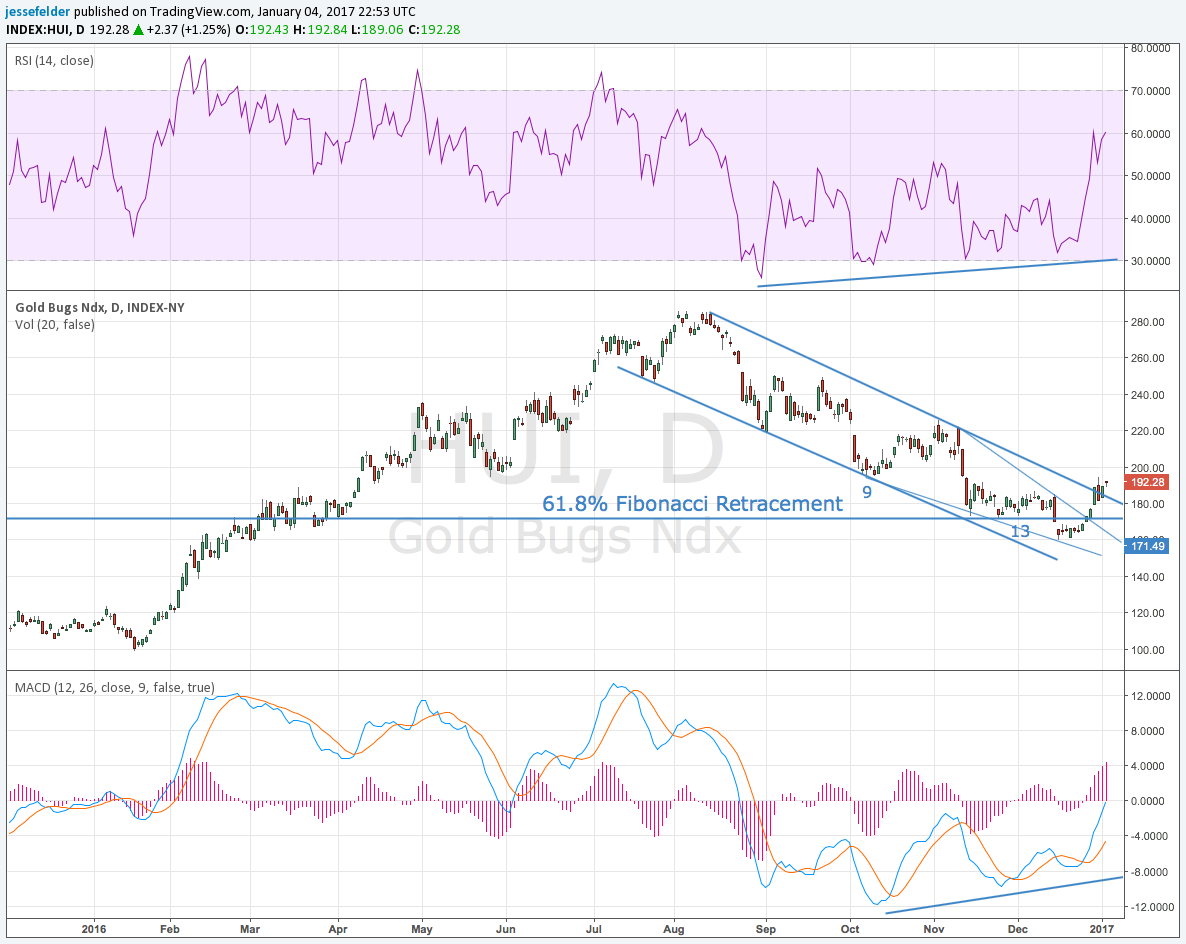
They might begin to notice, however, that gold stocks have now broken both their bullish wedge and their short-term downtrend line. They have also done so right at the 61.8% Fibonacci retracement of their 2016 gains. This recent selloff is starting to look more and more like a classic countertrend move.
Before we get ahead of ourselves, though, some have pointed out that the highest correlation to the gold price is the action in the yen versus the dollar.
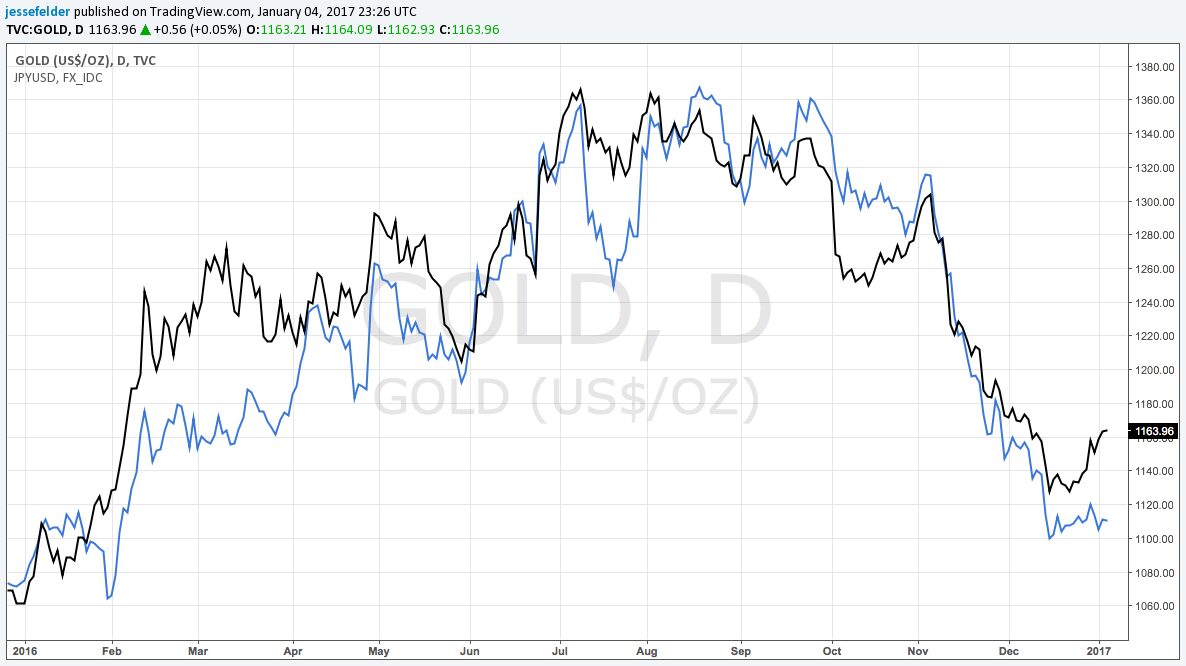
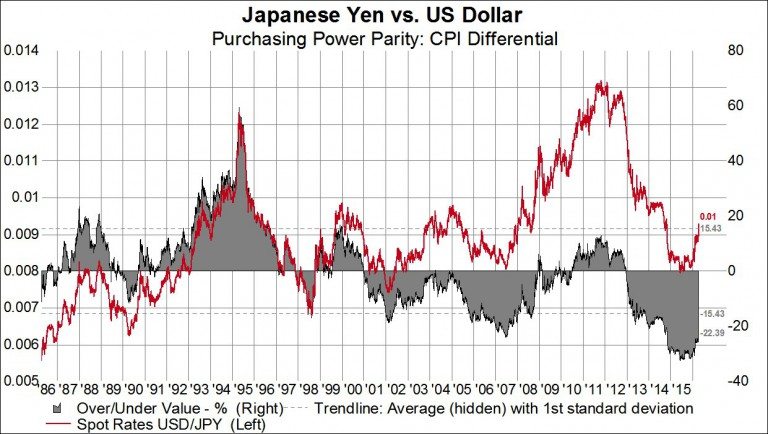
This appears to be true but I don’t see why this should be bearish for gold. In this regard, I would point out a couple of things. First, the yen is arguably the most undervalued currency (relative to the dollar) on the planet. The chart below, again from Gavekal, is a bit dated. With the yen’s recent selloff this measure has fallen right back near its all-time lows set in 2015.
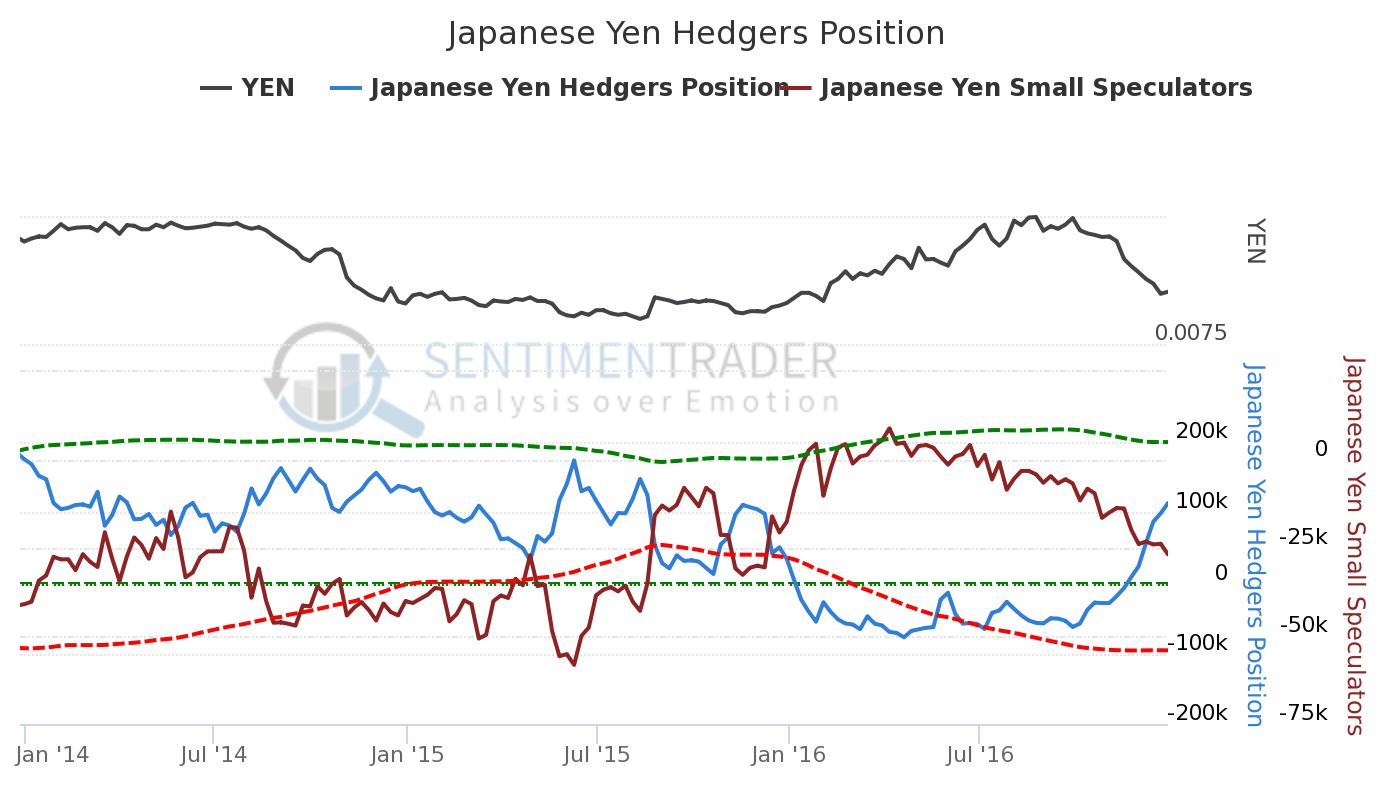
Just like they have in gold futures, commercial traders have recently been buying a ton of yen while small speculators have gone net short again for the first time since the yen bottomed in late-2015. So we could easily see the yen resume its rally that began in early-2016. In fact, if the Fed were forced to rein in its recent hawkishness, as it did early last year, I wouldn’t be surprised to see an even more violent reaction in the yen this time.
Still, even if we are witnessing a resumption of the gold bull market, gold stocks may take their time in finding their footing over the short run.
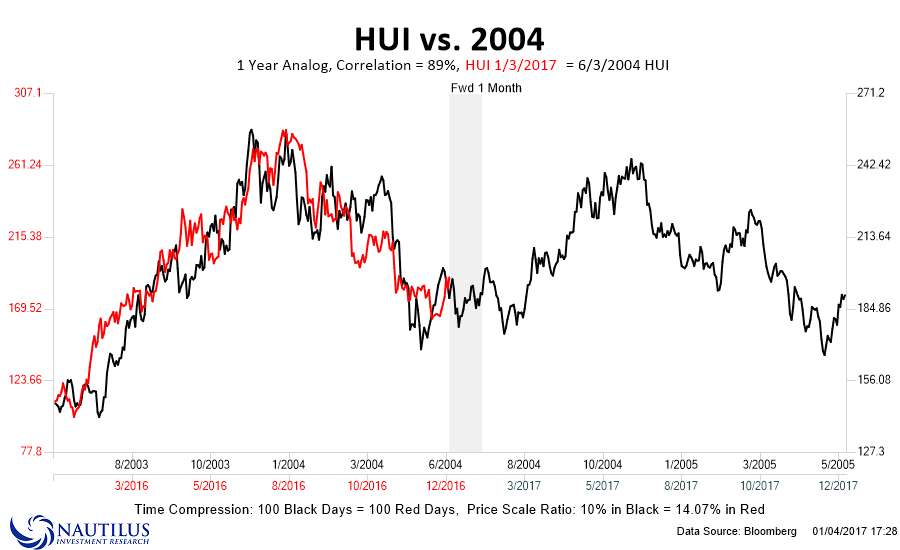
Over the long run, though, they could be setting up for another massive bull run.