A Healthy Paranoia
“You are neither right nor wrong because the crowd disagrees with you. You are right because your data and reasoning are right.” -Ben Graham
The hard part about being a contrarian is that you never quite feel sure of yourself. You constantly feel like you could be wrong because the crowd and the markets regularly tell you so and so you have to constantly revisit your research.
It’s a constant sense of unease or paranoia and I think it’s much healthier, at least from a financial standpoint more than an emotional one, than the feeling of confidence that comes from the validation of the crowd because it forces you to go over your own data and reasoning again and again to see where you might be wrong.
Right now you can see a very good example of this. The recent rally has left the few bears filled with doubt while the many bulls are filled with confidence. Spend any time on Twitter these days and this is quickly obvious (it’s also validated by a variety of data points). But it’s not price we should rely on, at least in the short run, to validate our opinions. It’s our data and our reasoning. If those are sound they will be validated by prices.
Those relying on short-term price movements to validate their views are regularly sucked in and then spat out of the markets with only losses to show for it, especially once they have embraced the strong sense of confidence that comes from trading with a growing herd.
This rally, like every other significant rally we have had over the past 18 months, has me once again filled with doubt and seeking to revisit my research and my reasoning to see if it is still valid.
I have suggested that the stock market, along with virtually every other financial asset, has recently become more overvalued than ever before. The record high in median price-to-sales valuations is clear evidence of this.
We got here only because of the unprecedented and rapid growth of price-insensitive buyers. These include passive investors, algorithmic traders, trend-followers and most notably corporate buybacks, which now make up the single greatest source of demand for stocks.
While this group has come to dominate the markets, liquidity has dried up as what I like to call natural buyers, those seeking to actually put capital to productive use, have stepped aside. This is evidenced by the fact that Lowry’s buying power index just hit a 6-year low.
This is part of the bull/bear cycle or the longer-term sentiment cycle. Investors shift from risk seeking to risk aversion. As they do, stocks lose momentum and the trend begins to reverse. This ongoing process is the reason the broad stock market has gone nowhere for the past two years.
It also coincides with waning risk appetites in the credit markets as a direct result of deteriorating credit conditions. After the massive surge in debt issuance over the past seven years, the boom is now turning to bust, ‘as surely as night follows day,’ to paraphrase a recent Jean-Marie Eveillard presentation.
As delinquencies rise, lenders are tightening standards leading to falling liquidity in the corporate bond market. As it does in every cycle this only exacerbates the downturn as struggling companies find it harder to refinance and become more likely to default forcing lenders to tighten further and on and on it goes.
Because companies have relied so heavily this cycle on debt to fund their massive buyback programs and acquisition sprees, this credit downturn is far more likely to have a direct effect on stock prices than any other time in the past.
To put it plainly, this nascent credit bust is taking the credit card away from the stock market’s single most important buyer: The companies themselves.
What is most worrisome to me this cycle is the fact that the Fed has pinned all of its hopes for economic recovery on the wealth effect they have printed so much money to create. If they are right about the connection between the prices of financial assets and the economy, the next bear market decline could precipitate another very painful recession.
Furthermore, because we are already up to our eyeballs in debt the Fed can’t hope to stimulate the economy by encouraging more debt creation. As Ray Dalio has been saying for over a year now, it is the end of the debt super-cycle. For the Fed this 35-year game of falling interest rates and rising debt is now up.
Even with my diligent searching, reading and studying charts and data points, I see no evidence to contradict any of this.
The credit cycle is very clearly turning.
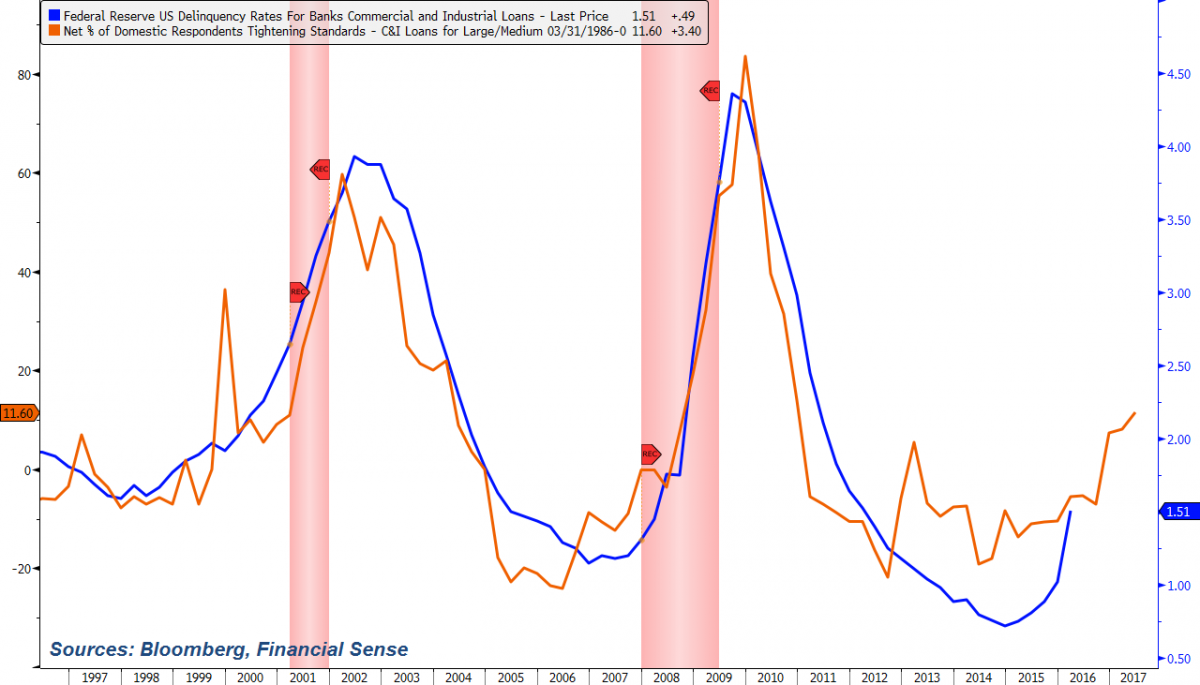 Chart via @FinancialSense_
Furthermore, the deterioration in credit is very, very rapid, albeit now rising from a very low level.
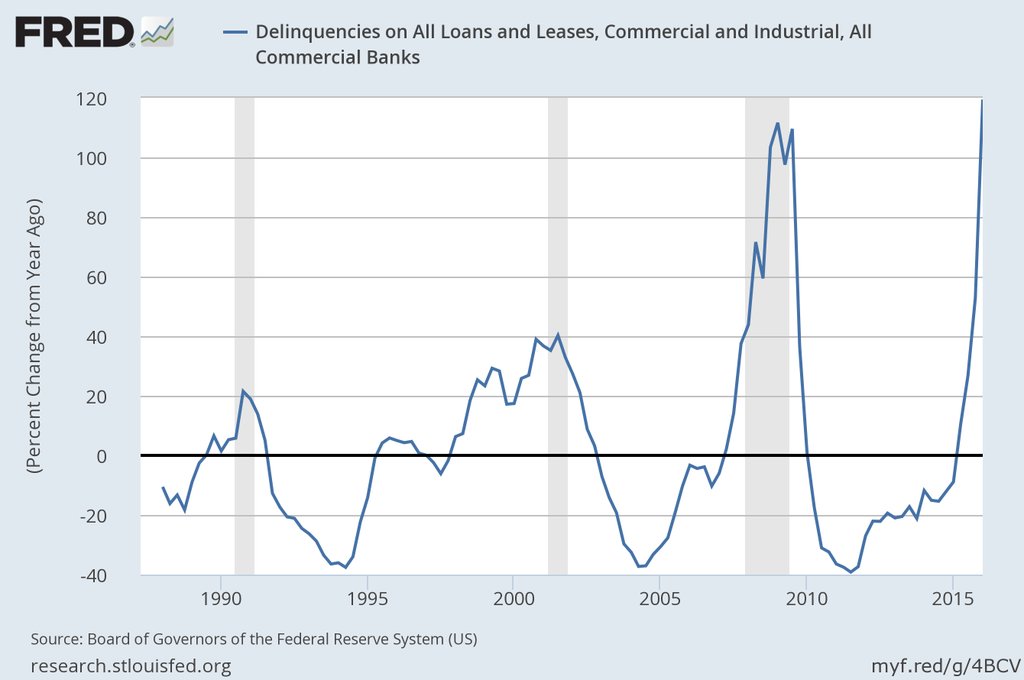 Chart via @DonDraperClone
This normally has a direct effect on employment. Those surprised by Friday’s weak report just aren’t paying attention.
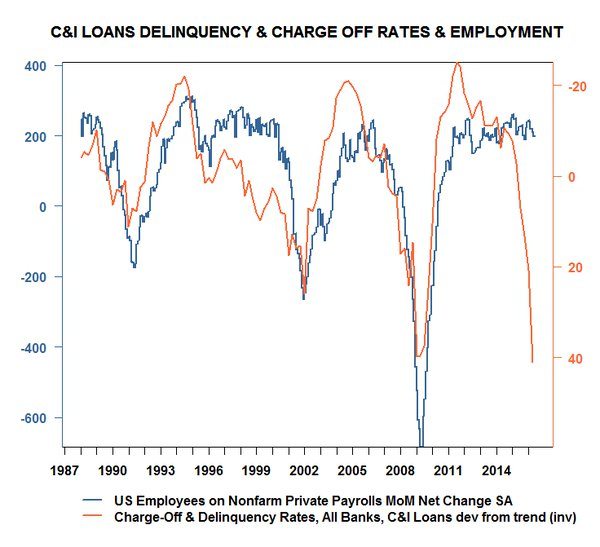 Chart via @CyrilRcube
The point is even while stocks have rallied the credit markets have continued to deteriorate. Because we are a finance-based economy, the credit cycle is synonymous with the business cycle. Thus the economy appears to be turning, as well. As one of the most lagging indicators of all, the jobs market is only beginning to reflect this.
The bulls would like to think that prices are telling a different story right now, but they always do early on in a bear market. Just before running into the rocks, investors are hopelessly taken in by the siren song of higher prices, even while they are unsupported by any data or reasoning at all. It appears this most recent rally has been driven by nothing more than massive short covering.
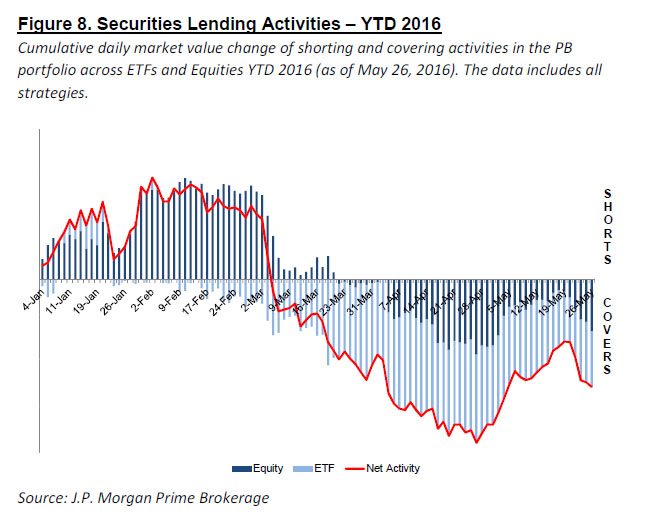 Chart via @zerohedge
Buybacks are already feeling the heat from the deterioration in credit.
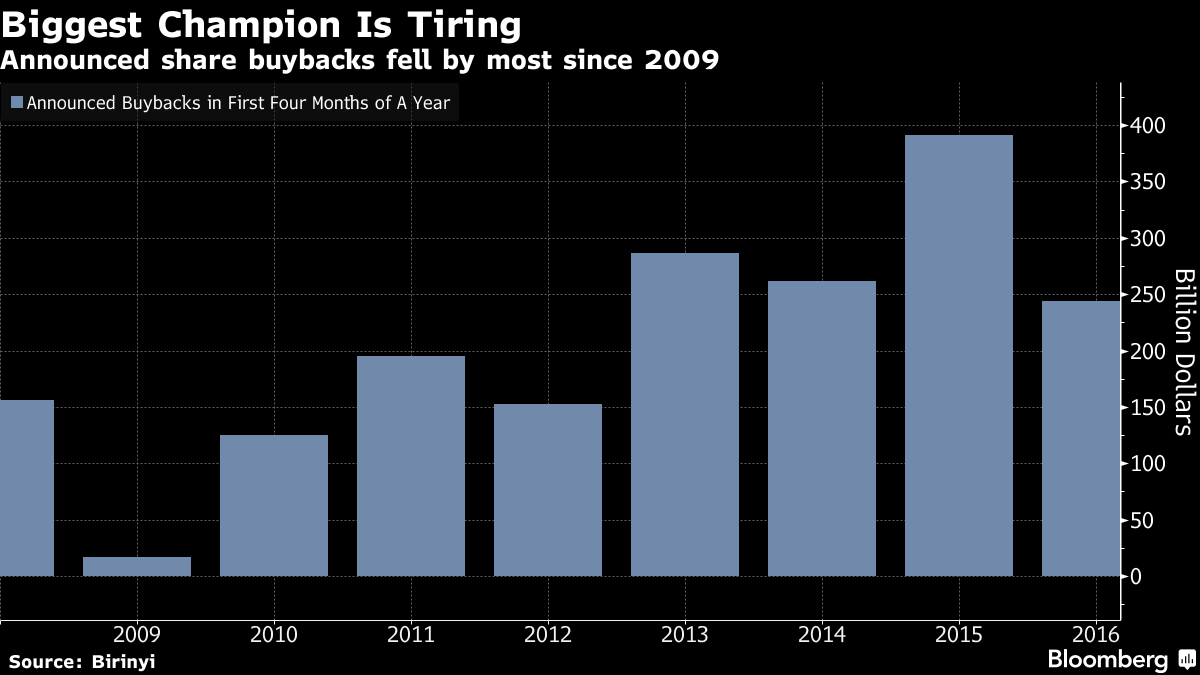 Chart via @business
And merger activity is also suffering.
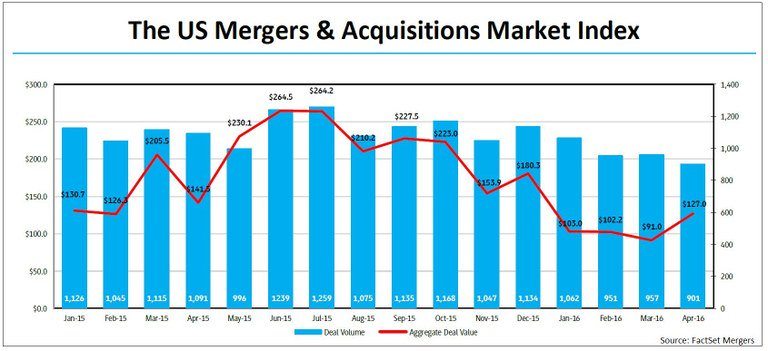 Chart via @FactSet
The bottom line is I strongly believe that the current rally is no different than either of those enticing rallies that peaked in May of 2001 or again in May of 2008, just before prices fell into the throes of those famous bear markets. Those few who are able to resist its siren song should maintain their most defensive posture.
An Interesting Opportunity Emerges From The Energy Bust
I recently noticed some interesting insider buying a pair of refining companies. While most energy companies have seen their stocks rally significantly over the past several months refiners, as a group, have not. Reuters explains:
U.S. refiners’ years-long boom from cheap and plentiful crude ground to a halt in the first quarter as swelling oil inventories and weak demand pushed revenues to their lowest in years and punished profits, results showed on Thursday.
PBF Energy Inc and CVR Energy reported quarterly losses of $66.5 million and $68 million, respectively, while Marathon Petroleum Corp eked out a $1 million profit after reporting earnings of almost $900 million a year earlier.
Each reported their weakest revenue in at least four years, reflecting the depth of the pain even as they cling to hopes of a rebound during the U.S. driving season, the busiest period of the year for demand.
In essence, refiners paid the price for ramping up production in 2015 to chase healthy crack spreads that led to higher inventories and weaker margins earlier this year as demand slackened during the mild winter.
Clearly, there are some important insiders who are not as pessimistic about this cycle as Mr. Market is right now.
At PBF, CEO, Thomas Nimbly, bought 50,000 shares last week for nearly $1.4 million, equal to about one-third of his annual pay. Two years ago he made a slightly larger purchase just before the stock price surged 30% higher. President Matthew Lucey also bought 10,000 shares of his own totaling just over a quarter million dollars. He was also buying alongside his CEO two years ago.
At Western Refining, we have seen a cluster of insider buying over the past month. President and CEO, Jeff Stevens, bought over 400,000 shares totaling roughly $10 million. This amounts to ten times his base salary. His last purchase of this magnitude was a buy of WNRL (the company’s LP) in October of 2013. That stock went on to double in price over the next 18 months.
Paul Foster, the WNR’s Executive Chairman and former CEO, also recently bought $10 million in shares, on top of the 20% of the company he already owns. Interestingly, his last major purchase was also nearly identical to Stevens’. Directors Brian Hogan and Robert Hassler appear to be piggy-backing on their trades this time making a pair of buys of their own. I should note the company is also in the midst of a sizable stock buyback plan.
Certainly, it appears that these insiders have been inspired by something. If I had to guess it would be that the markets are currently pricing in a continued rally in crude oil prices which would mean refiner margins would continue to come under pressure from narrow crack spreads. Perhaps this group is not as optimistic as the market in regards to the oil price rally. At the very least, they don’t appear to believe tight crack spreads will persist for very long. In fact, WNR cashed out of their distillate crack hedges in Q1 for that very reason.

The stocks’ dividend yields (7% for WNR and 4.5% for PBF) also look very attractive relative to the alternatives. The question is can they maintain them? That’s probably what Mr. Market is questioning right now as both companies paid out more than 100% of net income over the past 12 months. Still, it seems these execs buying stock aren’t nearly as worried about this as the market is.
On a final note, while I was reading through WNR’s first quarter conference call transcript, I noticed that there were only two questions asked during the call. This compares to roughly 10 pages of questions for PBF during their call. It seems there is currently very little interest in WNR from Wall Street. On the other hand, one person who does appear to buck this trend is hedge fund legend Steve Cohen, who owns one million shares for his family office.
On Friday, I started a small long position in WNR. I intend to dive deeper into these two companies over the next week or two with more of an emphasis on WNR. If you have any insight you would like to share I’d encourage you to send me an email at [email protected].
Note: This post was updated by removing an older chart of crack spreads and replacing it with a more relevant one.
