The latest Z.1 data was released yesterday showing that, as of the end of the year, the stock market was still very overvalued, investors were still overly bullish and the S&P 500 was still very overbought relative to its long-term regression trend. In other words, this is still the worst possible environment for equity investors.
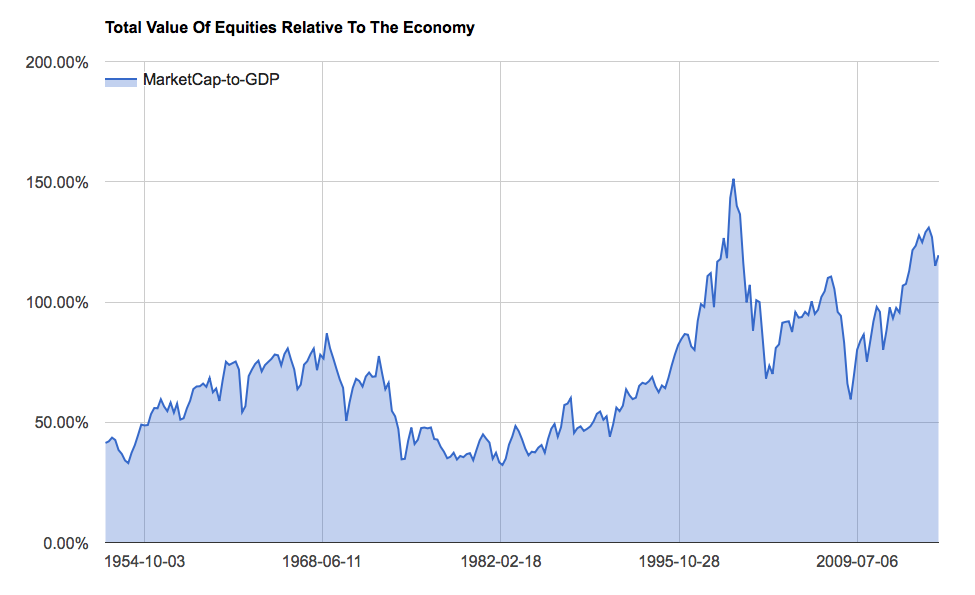
Let’s start with Buffett’s favorite valuation yardstick, total equity market cap relative to GDP. It still shows the broad stock market to be more highly valued currently than any other period during the past 60 years outside the peak of the dotcom bubble.
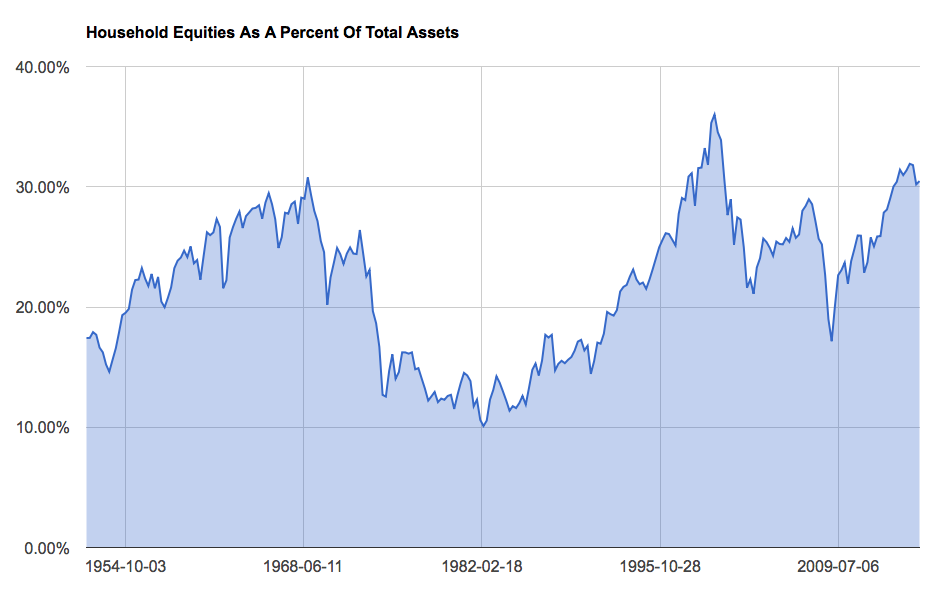
The percent of household assets allocated to stocks is also hovering near record highs, suggesting investors have rarely been more bullish than they are today.
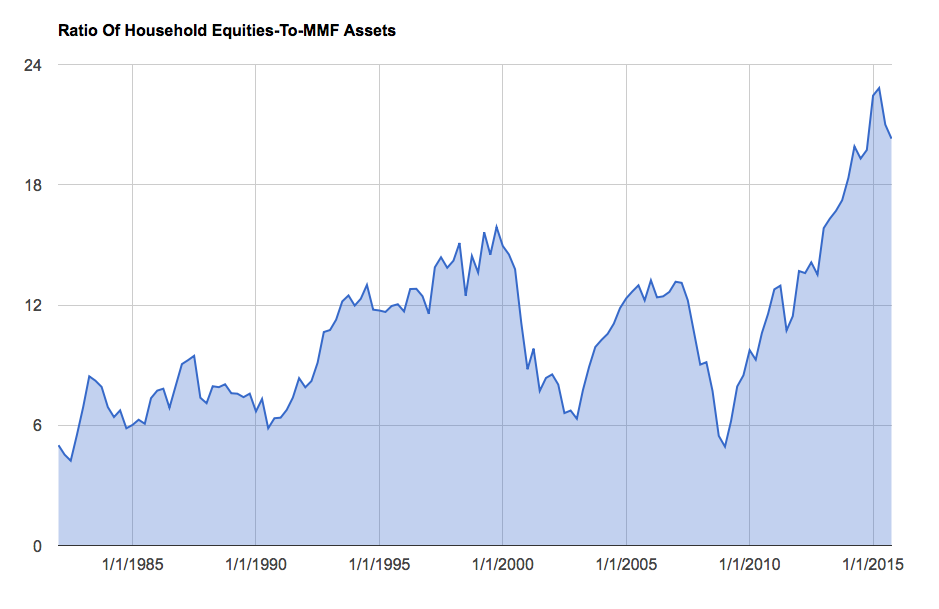
Even more interesting from a sentiment standpoint, however, may be the ratio of household equity holdings to money market funds assets. This ratio is just off its all-time high set during the second quarter of 2015. Yes, this is likely due to seven years of ZIRP but it’s hard to argue that investors haven’t completely bought into the TINA argument over that time.
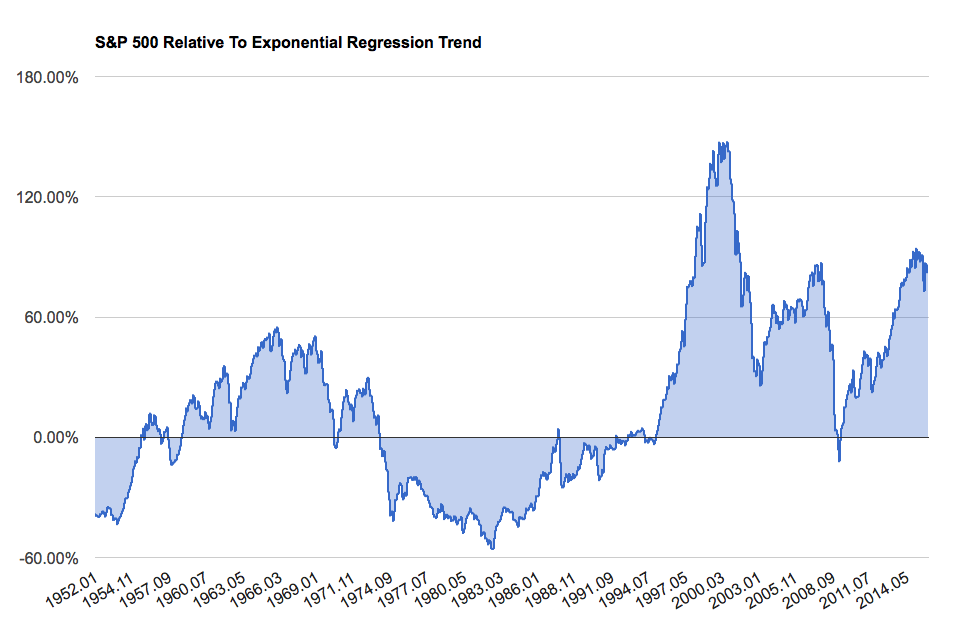
Finally, the S&P 500 finished the month of December 82% higher than its exponential regression trend line. This is roughly where it stood in the Fall of 2007 just prior to the financial crisis. (It is also roughly the level attained just prior to the crash of 1929, as well, though this is not pictured in the chart below.) The only time it’s been higher than this is, you guessed it, during the height of the dotcom bubble.
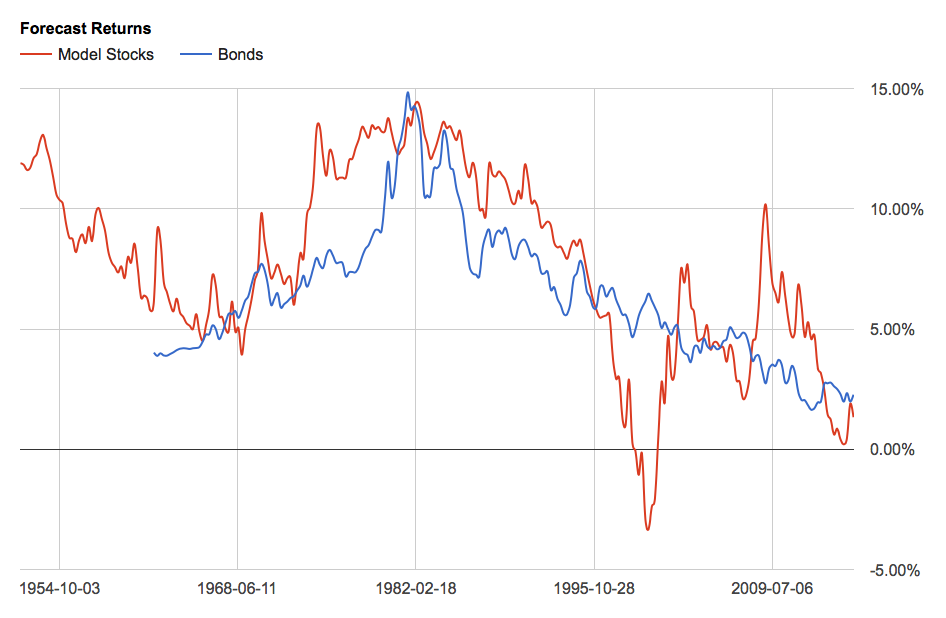
When you combine these three signals (not including the money market fund ratio) we get a blended forecast of 1.33% for the broad stock market annually over the next decade. Since 1951 this model has an 89% correlation with forward 10-year returns so it’s something worth paying close attention to. Compare that prospective return to the 2% offered by the 10-year treasury note and it’s hard to argue that stocks currently offer adequate reward to offset their much greater risk.
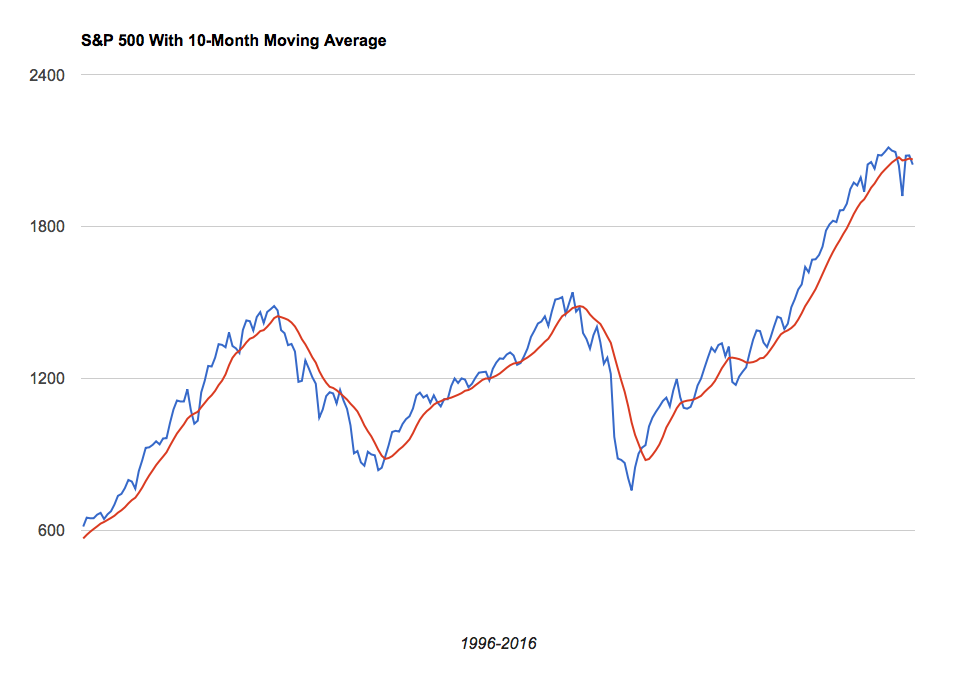
What’s more, the S&P 500 in December closed beneath its 10-month moving average signaling a long-term trend reversal.
At the end of 2015, stocks remained very overvalued, over-bullish and over-bought and the trend had reversed to the downside. None of this has changed in the 70 days since. And in the past, this setup has led to some of the worst bear markets we have ever seen.
Ultimately, equity investors currently face the very real prospect of another massive potential drawdown in hopes of achieving an annual return less than the “risk-free” rate. That’s not a risk/reward equation that should get anyone excited about owning stocks right now.
