The January margin debt figures were released earlier in the week and there are a couple of interesting things to note. First, though it is still very elevated, margin debt-to-GDP has now fallen to its lowest level in over two years.
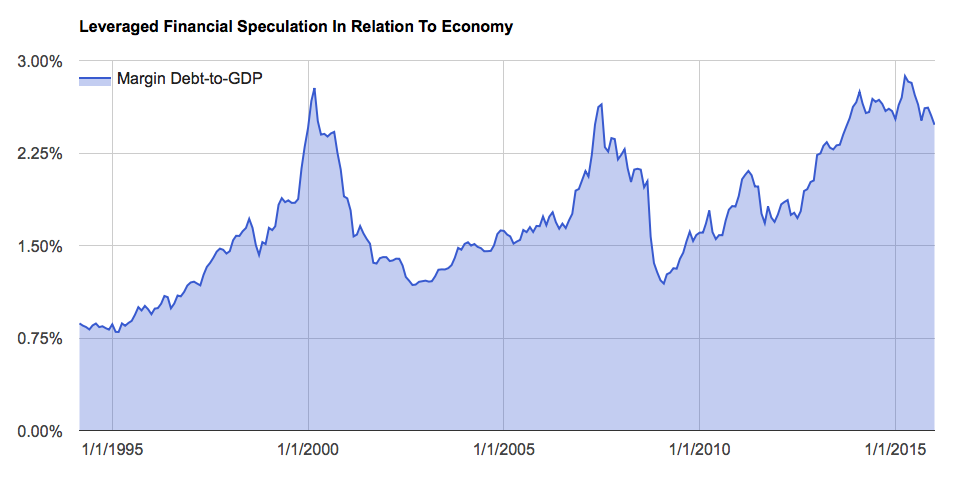
I prefer to look at this measure rather than the aggregate level of debt on its own because this ratio is highly correlated to future 3-year returns in the broad stock market.
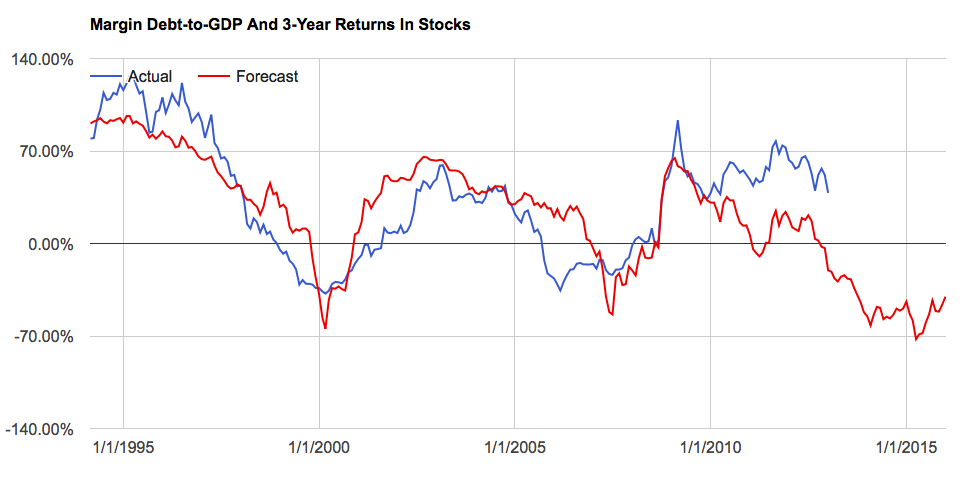
There are only two prior occasions where margin debt-to-GDP rose above 2.5% and then fell to a 2-year low. Those were March of 2001 and October of 2008. Now it’s hard to glean anything from just two prior occurrences but they would suggest, at a minimum, that we are at risk of falling into another major bear market if we haven’t done so already.
To explain, I view margin debt as one of the best indicators of potential supply and demand for risk assets, namely stocks. Very low levels of debt suggest there is a great deal of potential demand for equities out there should investors feel inclined to borrow and buy. Early in a period of rising risk appetites, this can be a very bullish catalyst for higher equity prices.
Conversely, very high levels of margin debt suggest just the opposite. Should investors feel inclined to buy they have very little ability to borrow more to do so. However, during a period of risk aversion, high levels of margin debt suggest there is a great deal of potential supply that could come to market. It makes no difference if this potential supply becomes real supply as a function of investors own volition or at the insistence of their brokers it always means the same thing: rapidly falling prices.
The trend in risk appetites, then, is the key to this supply/demand puzzle presented by margin debt. The fact that the major equity indexes are below their 200-day moving averages and corporate spreads have been widening for nearly two years suggests the trend in risk appetites has shifted from risk seeking to risk aversion. And this is now confirmed by the trend in margin debt. Because margin debt as a percent of economic activity is now reversing lower from the highest level recorded over the past few decades, the “risk” in risk assets like equities may be as high or higher today than any other time during that span.
And speaking of credit, my friends over at Hedgopia discovered another fascinating correlation this week between the trend in margin debt and that in commercial lending:
Turns out, margin debt tends to strongly correlate with U.S. banks’ commercial & industrial loans. In fact, R between the two over the last 35 years is 0.96 (Chart 3). Damn tight!
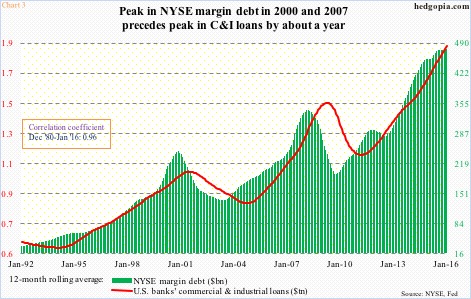
As noted in the chart above, margin debt peaks have led peaks in commercial lending by about a year. The absolute level of margin debt peaked April of last year. If this relationship holds, commercial lending should begin to peak any day now. And we may already be seeing signs of the peak right now.
Demand for commercial loans falls at the fastest pace in years amid tightening standards: pic.twitter.com/Kqgzib0Ftk
— Jesse Felder (@jessefelder) February 2, 2016
As the economy has become even more finance-centric in recent years, it only makes sense that credit, which drives both asset prices and economic activity, would be correlated in this way. And the message for investors couldn’t be more clear: Pay very close attention to the larger credit cycle.