I’ve been waiting for a decent setup to short one of the major indexes as a trade and I think it’s finally arrived. To be clear, we don’t have a longer-term trend signal for this short sale. We will need that before we put on any shorts in the tactical portfolio. However, as a trade this is looking very ripe.
Sentiment, as indicated by the ISE call/put ratio and SentimenTrader’s smart/dumb money ratio, has recently become very extended. Stocks usually have a difficult time moving higher when this is the case.
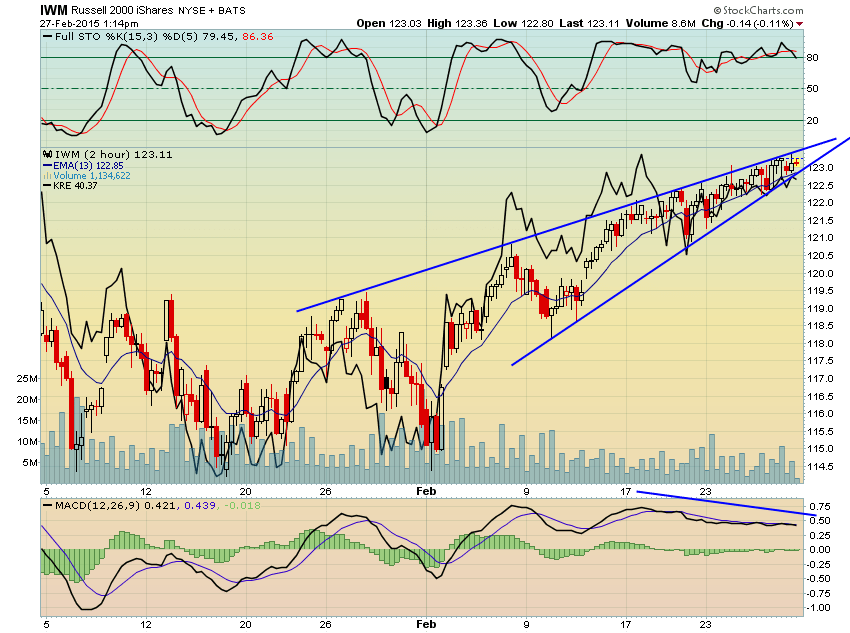
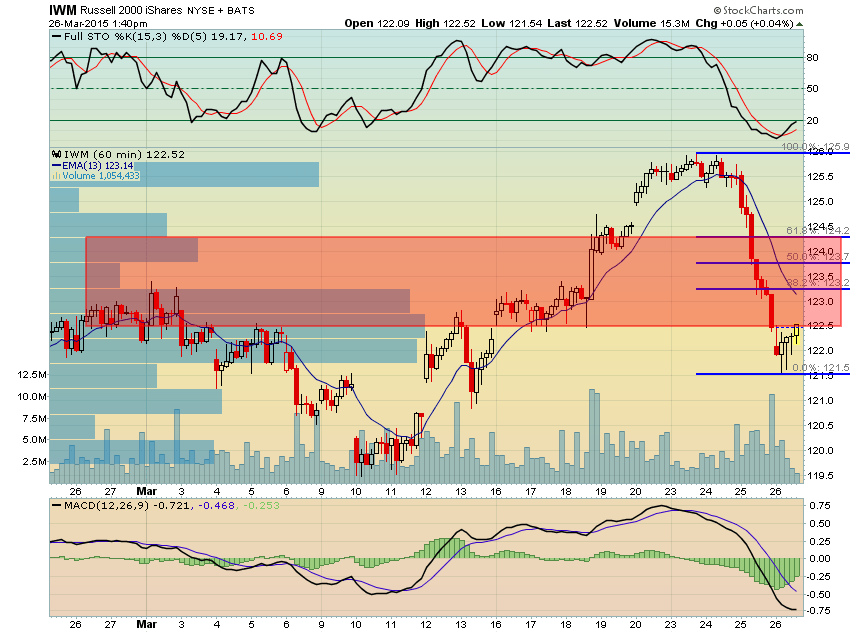
Technically, after breaking out to new highs the market has extended further over the past week or so even while breadth has weakened. The 2-hour chart of the Russell 2000 Index now shows a clear ending diagonal pattern. Once this breaks the move lower could be swift:
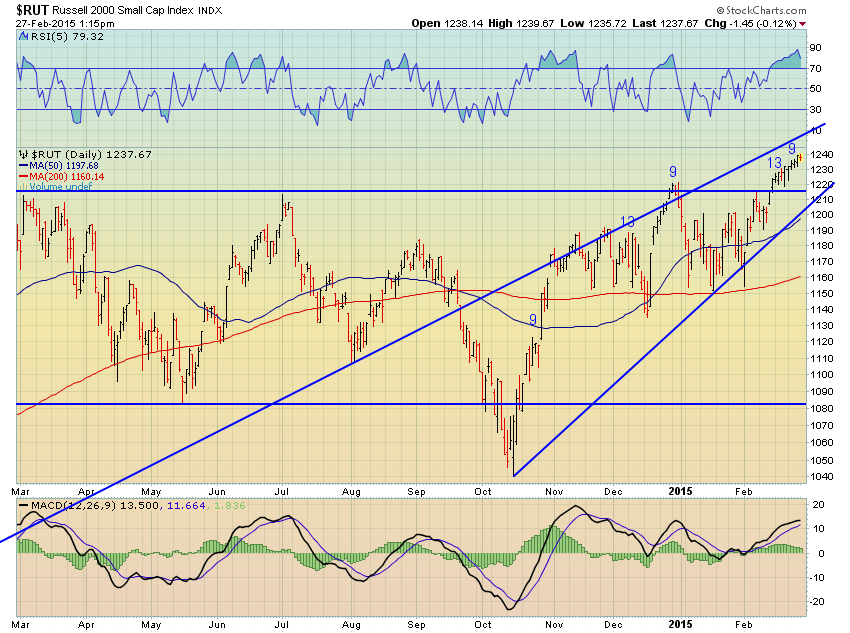
On the daily chart, the index recently became very overbought amidst another DeMark sell signal and completed setup. It’s now beginning to retreat from the overbought level which has been a good signal in the recent past that the index was about to retrace at least part of its recent ascent.
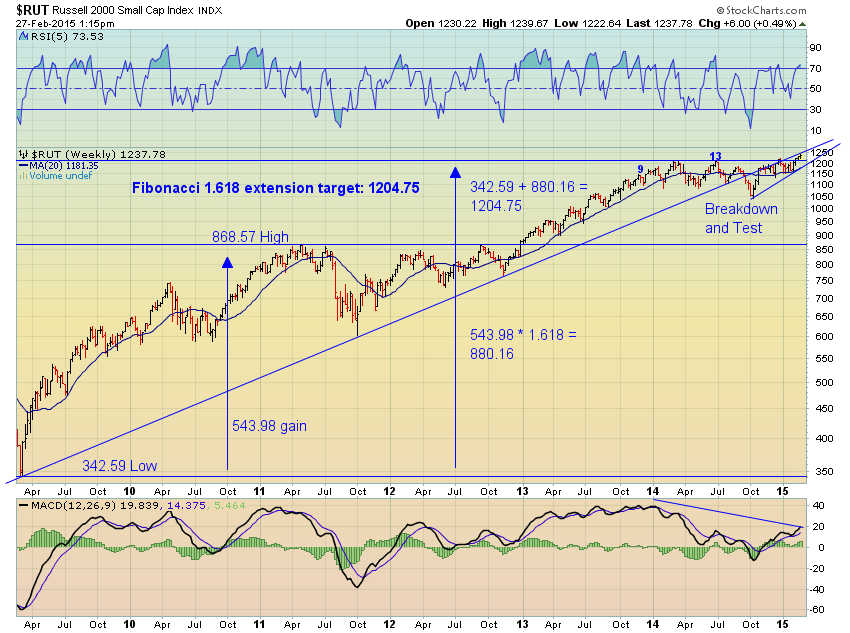
The weekly chart is one I’ve been watching for a long time now. Ultimately this breakout above the key Fibonacci resistance could prove to be just another fakeout as the index just tests the underside of its now broken uptrend line.
I would look at either TWM or SRTY as a vehicle for playing this trade and using 1250 on the index as a stop loss level.
Note: It can’t be considered a small cap in any way but I’ve also taken another stab at shorting Facebook though I’m not adding it to the active trade ideas again. A move below 74 would setup another low-risk short and at that point I would add it back to the active trade ideas page.
UPDATE (3/18/15 – 2:43pm): I called an audible today and removed my stop after the FOMC announcement. The recent move higher still feels like part of a broader topping process. Today’s action feels like it could be reversed in quick order and I wanted to give the trade a bit more room. I am now using today’s highs as my new stop. Should IWM take out those levels this trade will be closed.
UPDATE (3/21/15 – 4:44pm): We were stopped out at the open on Friday. I will look to put this trade on again sometime soon once the opportunity presents itself as I still believe the market is in a topping process and this is one of the most vulnerable areas. See this weekly market comment for more.
UPDATE (3/25/15 – 2:45pm): Well, I thought we might have been stopped out at the wrong time and that turned out to be the case. The move today is exactly what I have been looking for since we first put this trade on – it wiped out all of the gains made over the past seven trading days. This is exactly why I tried to call the audible on Fed day and stay in the trade. I’m not giving up on it, though. In fact, I think this may be just the beginning of a great longer-term trade from the short side. I will be watching carefully for a weak rally to sell now so stay tuned.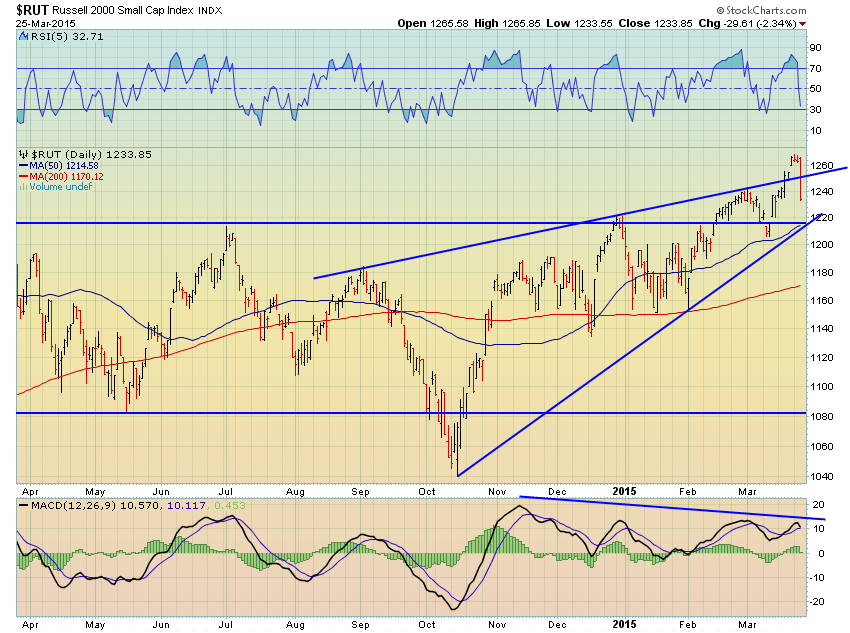
UPDATE (3/26/15 – 10:43am): I’m going to start scaling back into a short position here using a trade above the recent highs as a stop. 123.3ish on IWM represents the high from earlier this month along with the approximate 38.2% retracement of the recent decline. The 13-day ema is now declining and sits at 123.41 (not pictured). 124.25 represents the post-FOMC highs and the 61.8% retracement. If it can rally up into this range I think it will present a nice short setup. I’m going to start a 1/3rd position right now at 122.73 looking to add the other two thirds around these two levels above.
UPDATE (3/28/15 – 11:51am): I received an email from a subscriber regarding this trade asking for a bit more clarity. I apologize for not spelling things out better. I’m going to systematize this process so that every level that matters to the trade, especially stops, are clearly defined and added into the “trade ideas” spread sheet. No more “ish” when it comes to levels. I put the first third of the trade on at 122.73. I put another third on on Friday when IWM tagged the 31.8% retracement at 123.22. I will put the final third on at 123.74, the 50% retracement. My stop is at 125.5 right now. Hopefully, we get a little gap up opening on Monday that will trigger the final third here. We shall see.
UPDATE (3/31/15 – 4:58pm): You may have noticed this trade is now consolidated into our model portfolio. Simply for ease of use I am employing a long position of SRTY (leveraged inverse Russell 2000 ETF) there rather than a short IWM. You may choose to use either. It really doesn’t matter much as they both should accomplish the same thing so long as you account for the leverage in SRTY versus IWM. Specifically, you would need to own only 1/3rd as much SRTY as you would otherwise be short IWM due to its leverage.
UPDATE (4/15/15 – 11:17am): We were stopped out of SRTY this morning. It still feels very toppy but discipline over conviction means we step out of the way right now.
UPDATE (4/20/25 – 8:14am): As noted in two email alerts this morning we have reestablished this trade at 25.54 and 25.08 for an average price of 25.31.