At today’s closing price I’ll be adding a new trade idea: short Facebook. I’ll also adding a section on the “Trade Ideas” page about how I would go about implementing these ideas, generally.
Mr. Market today says that Facebook is worth $200 billion, more valuable than Home Depot, Visa, McDonald’s, American Express and Boeing. Is he right? I don’t know. The first step in answering that question, perhaps, is to ask whether Facebook will be more or less valuable in 10 years than it is today.
I’m fairly confident that Facebook will be around in 10 years. I’m also fairly confident that it won’t be as popular then as it is today. The technology world just changes too quickly. It’s nearly impossible to know who will climb to the top of the hill 10 months from now, let alone 10 years from now.
So it’s very difficult to value a company like this. What’s not so difficult is to determine whether Mr. Market is too optimistic about that assessment or too pessimistic. And at 70x earnings and nearly 18x sales, I believe he’s too optimistic currently.
I’m not going to get into the user growth story. There are just too many moving parts. Let’s just say I think the company counts too many people as active users. Revenue growth, on the other hand, is bound to start slowing as they have monetized the website over the past couple of years about as much as they can.
If you use it you probably have noticed that your feed has gone from being all friends’ updates a couple years ago to nearly all paying pages’ updates currently. It would be hard to include more advertising without losing users. They do have the ability to monetize instagram and whatsapp but those are not nearly the same opportunity the site presented before it was monetized.
If you believe that revenue growth must slow (something they may have hinted at during the last conference call) then the valuation of the company must reflect that. In contrast to Facebook’s 17.x, Google trades at a mere 4.5x revenue (both are essentially online advertising companies). So even assuming that Facebook revenue doubles from here to around $22 billion, a 4.5x multiple would value it at roughly half its current valuation today.
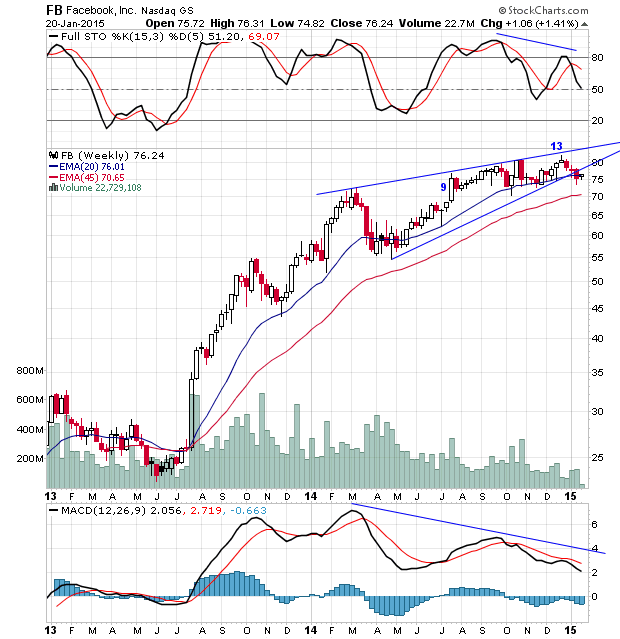
But this is a trade, not an investment, and the real bear case I’m looking at is in the charts. On the weekly chart, the stock has broken down out of an ending diagonal pattern (one of my personal favorites) in the midst of a DeMark Sequential sell signal. Stochastics and MACD also show divergences from the recent new high in price:
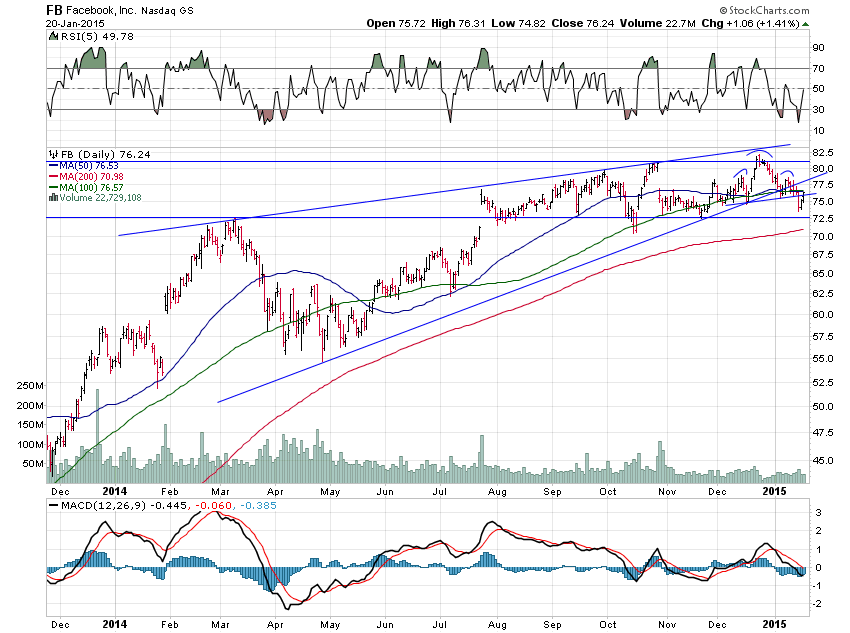
The daily chart shows that the stock has formed a neat little head and shoulders pattern with its 50-dma for a neckline. That pattern broke down and the stock is now testing the underside of the neckline (also one of my favorite setups):
To be sure, the stock could continue to run higher in the short term to the 78ish area, the underside of the lower trend line in the ending diagonal so it may make sense to scale into the position in thirds over the next week or so. Much higher than that and I expect the thesis to be proven wrong so I’m using a stop of 79.5. (Please see the “Trade Ideas” page for recommendations on position sizing.)
Having said that, it looks like Facebook is getting ready to roll over and the target for the ending diagonal pattern is around $55. All in all, then, the trade risks $3 to make $20, the type of risk/reward setup that makes sense to my mind.
Insiders have also been selling hand over fist but this is nothing special for a company like this that has issued literally hundreds of millions of shares in options. And no particular transactions really stand out to me so this is more of a neutral, if anything.
Finally, sentiment has been very bullish for this stock, a good contrarian signal. Optix sentiment recently hit an unusual extreme:
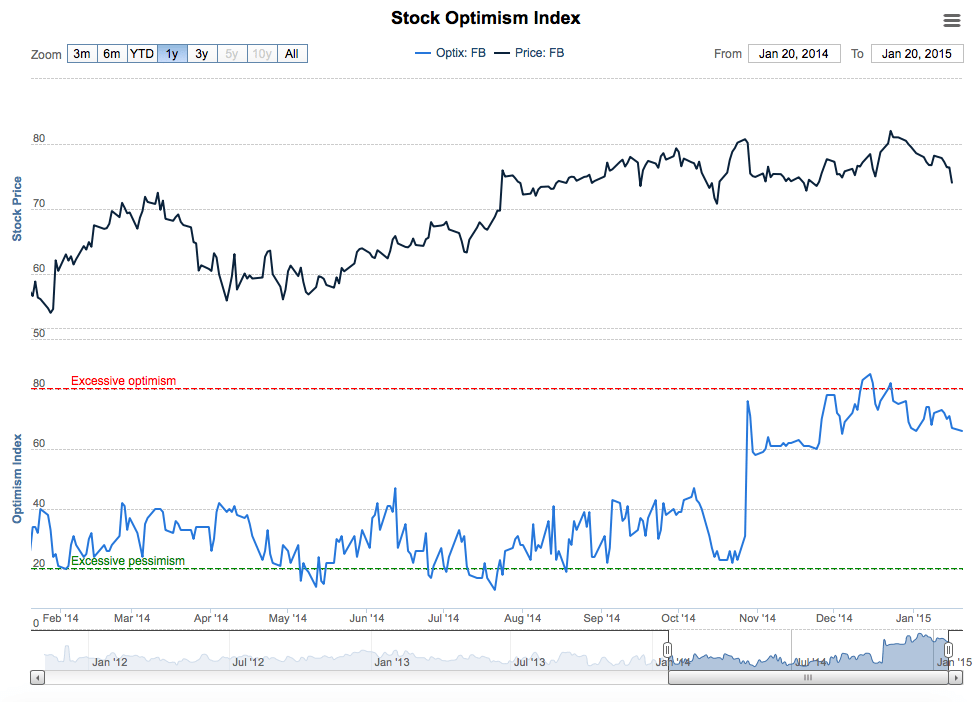 Chart via SentimenTrader
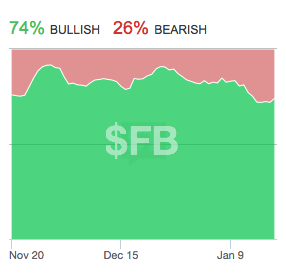
And social media sentiment is also just starting to turn down from over-optimism:
 The company will announce earnings January 28th and that’s usually a volatile period. In addition, I usually don’t encourage individual investors to sell short. For these reasons I’m labeling this trade as “high risk.”
UPDATE (1/28/15 – 10:11am): Facebook announces earnings after the market close today so I thought I’d just go over a few of the main points in this trade idea. To be clear, this is a very speculative, high-risk trade. But here are a few reasons I like it as a short sale.
First, revenue growth at the company seems to be slowing fairly dramatically. After posting year-over-year growth of 64% in Q3 the company forecast growth of 40-47% in Q4.
There are three main factors that go into this: desktop revenue growth, mobile revenue growth and currency headwinds. As for the desktop (Facebook.com), revenue growth was flat in Q3 and I’d be surprised if it doesn’t begin to decline in Q4. A quick check of web traffic to the site shows that Facebook.com could be seeing a rapid decline in use and engagement. The chart below tracks unique visitors:

This next chart tracks engagement on the site over the past three months:

So it looks like the company’s flagship product, Facebook.com, is seeing an exodus of engaged users.
The second factor in the company’s revenue is mobile advertising. This now accounts for about two-thirds of the company’s overall revenue so it is probably the most important. When the company first began to monetize its mobile apps, including Instagram, revenue growth exploded. However, I suspect that this opportunity has been already captured to a large degree and the rapidly slowing revenue growth is red flag.
Finally, the company blamed their conservative guidance during the last earnings call in on currency headwinds. At the time, the dollar had only just begun its surge against the Euro and the Yen. The fourth quarter really saw the dollar surge accelerate. For this reason alone, I believe the company may report revenues closer to the lower end of their guidance than the high end.
Aside from these fundamentals, insiders have been dramatically reducing their personal stake in the company really since it went public. This is not typically a bearish sign as it’s only reasonable for execs to want to diversify their net worth when it is so heavily dependent on only one company.
However, Sheryl Sandberg, the company’s COO, has reduced her stake from over 10 million shares a year ago to roughly half that today. While she’s still exercising option grants she’s also selling about 500,000 shares per month on at pre-planned divestiture program. Without any new grants or exercises that means she’d be completely out of her entire stake in only 10 more months time. That’s a fairly rapid divestiture plan.
In addition, the company’s new CFO, David Wehner, has exercised nearly 50,000 shares in options just since August and didn’t think it a good idea to hold onto even one of these. He owns no stock in the company outright. I see both of these insider’s trades as leaning bearish even if they aren’t outright so.
Investors, on the other hand, are extremely bullish heading into the earnings report tonight. On Stocktwits I’m hearing from a lot of novice traders who are buying call options ahead of the announcement. Optix sentiment is also just about as optimistic as it was heading into the last report, when they disappointed investors:

Looking at the Estimize numbers, both analysts and investors are expecting the company to hit the high-end of their projected revenue range:

Finally, the technical picture is still very bearish. The stock has broken down out of its ending diagonal (with DeMark sell signal) and is now testing the underside of the uptrend line:

I don’t normally like to focus on such short-term trading and issues. I find it much more rewarding to focus on the long-term. And longer-term, Facebook is an advertising company, a sector which is usually highly cyclical. This is one reason why I’m also bearish over a longer time frame, as well. However, I think there’s currently a large discrepancy between what investors expect from Facebook and what they are really currently capable of delivering.
UPDATE (2/5/15 – 11:32am): Well Facebook didn’t sink on the day after earnings like I thought it would but it has been much weaker than the broader market since then. My biggest takeaway from the earnings report, which is filled with the smoke and mirrors of “non-GAAP” accounting measures, is that growth in cash flow per share has slowed dramatically.
After growing 127% from 2012 to 2013, cash flow per share grew a relatively modest 15.5% from 2013 to 2014. Holy deceleration! Does this drastically slowing growth support a 40x price-to-cash flow multiple (70pe)? On top of that, during the call the company gave no guidance for any financial metrics for the first quarter of 2015. I find it hard to conceive of any positive or bullish reason the company would do this.
Technically, the weekly chart still looks like a broken ending diagonal with DeMark sequential sell signal:
