I titled my latest weekly newsletter (subscribe here for free), “The Trend Is Still Your Friend But Beware The Fat Tail.” After today’s action, however, you could make the case that the trend might be more of a frenemy at this point.
Stocks sold off across the board and all of the major indexes have now lost their weekly uptrend lines and 20-week moving averages.
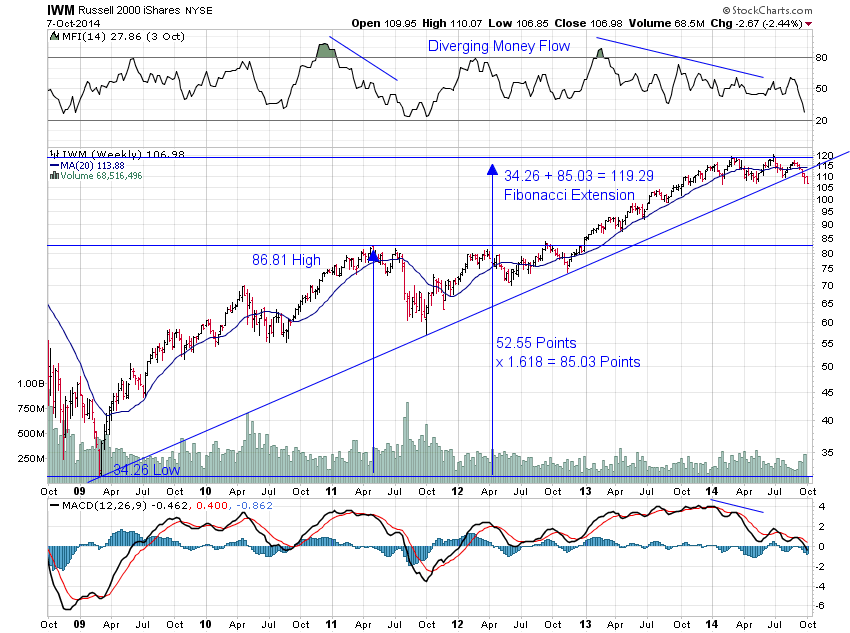
The Russell 2000 Small Cap Index has been leading to the downside ever since it peaked back in June. It has now broken the uptrend line that dates back to the 2009 low. It’s also formed a series of lower highs and lower lows, the definition of a downtrend.
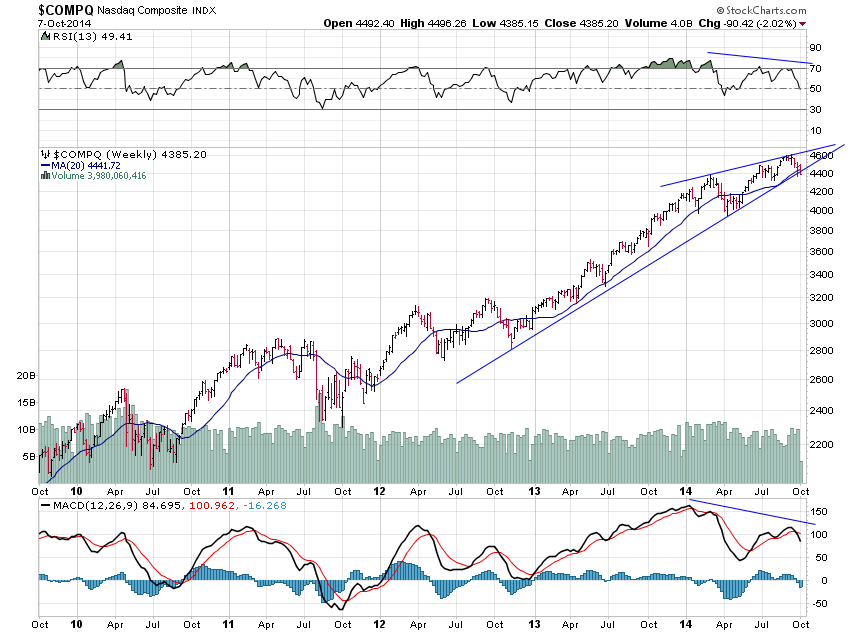
The Nasdaq started testing its uptrend line last week but managed to close above it on Friday. Today, though, it broke it again along with its 20-week moving average. We’ll see if closes the week below or manages to pull another late-week rally.
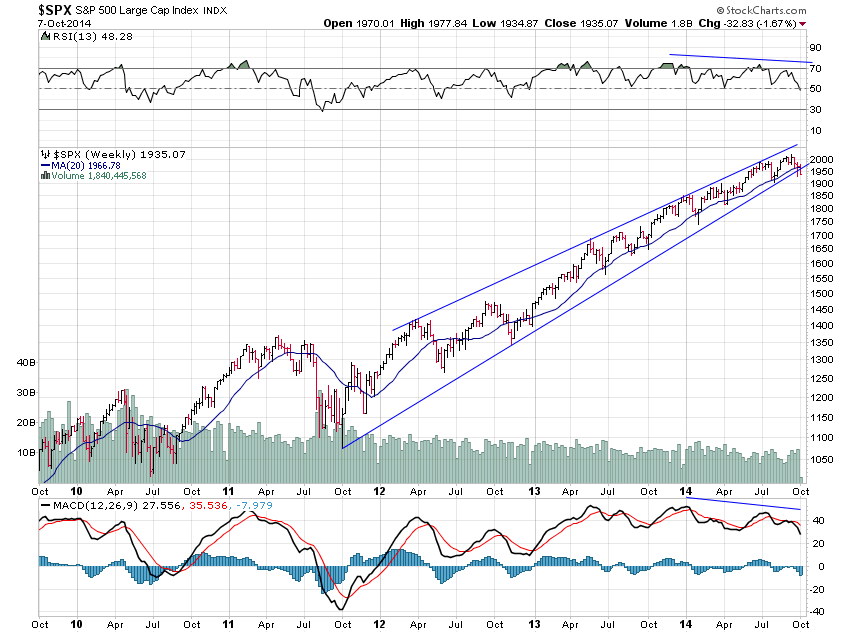
Finally, the S&P 500 looks fairly similar to the Nasdaq in that it’s broken below both the weekly uptrend line and the 20-week moving average. The wedge pattern/ending diagonal on this chart is also worth noting because when these pattern work they usually see all of the gains made inside of them given back. That would take this index all the way back to roughly 1,100 (45% decline from the highs). I’m not saying this is likely, just that’s it’s possible.
So the weekly charts are suggesting the current trend, that dates back to at least late 2012, may be coming to an abrupt end. It all depends on the latter two indexes and whether they intend to follow the Russell 2000. As I’ve written recently, the Russell could be an important canary in the coal mine not only in a fundamental sense but in a technical one, as well.
For more information about “trend following” read this.
UPDATE (10/10/14): The Nasdaq and the S&P 500 both finished the week lower resulting in a weekly close below these trend lines and their 20-week moving averages.