(If you enjoy reading my blog please subscribe to The Felder Report via email and follow me on Twitter @jessefelder.)
Three months ago I published a short piece titled, “Taking a shine to the gold miners,” and the ETF subsequently jumped a little over twenty percent. Recently, however, it has given back a good chunk of those gains and I’m once again intrigued by the trade.
Now I’m not going to try to make the fundamental case for owning gold. You can find great arguments being made on both sides of that debate (see “The Great Gold Debate“). Either you believe that gold is a unique store of value or that it’s just a shinier metal than most. What I’m interested in right now is the technical picture and general sentiment towards the asset after a three-year bear market that has seen the precious metal drop, in dollar terms, nearly forty percent.
On a long-term time frame gold is testing a pretty important uptrend right now. Actually, it’s fallen below the uptrend but I’ll be looking for a monthly close below the trend line and/or the 10-month moving average (both around 1275) to determine that the uptrend line is officially broken and there’s a lot of time left in the month of September for it to rally back and close above.
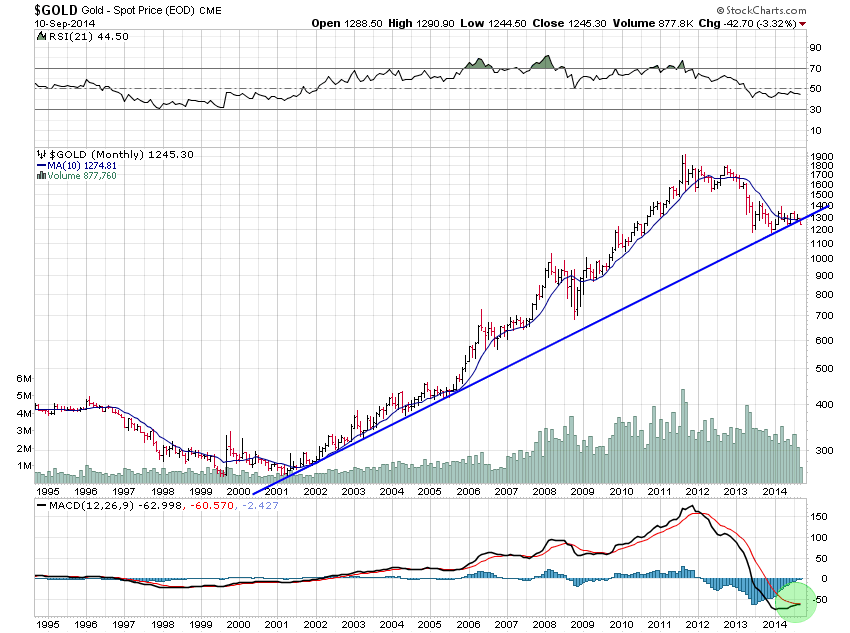
The MACD lines at the bottom of the chart are also getting very close to turning higher. Notice they last crossed down back in early 2012 which turned out to be a great signal to get out if you owned any gold at the time.
Looking at the gold ETF on a weekly time frame (a chart I posted at the end of last year on my public StockCharts chart book), it’s clearly breaking down out of a bearish pennant but key support lies just below at the 61.8% Fibonacci retracement around 113.68 (roughly 1200 for the precious metal).
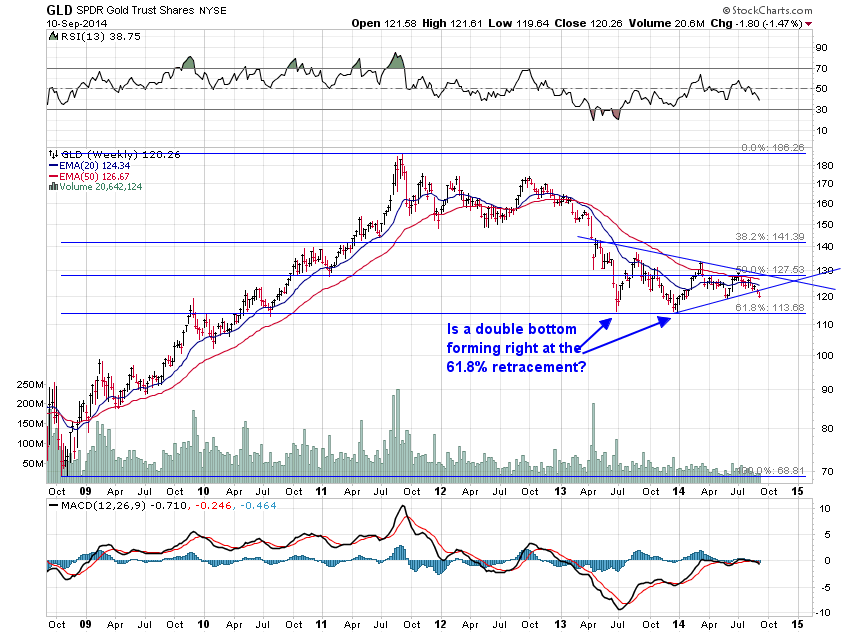
So the metal is at a crucial juncture right here. Can it hold the monthly uptrend and the weekly 61.8% retracement level? Time will tell.
Should they both manage to hold these key leves, the best way to play it may be through the gold miners ETF. A look at the weekly chart here shows a potential variation of a head and shoulders bottom with a DeMark 13 buy signal. Technically, you could argue the price action is either basing for a reversal or flagging before continuing lower.
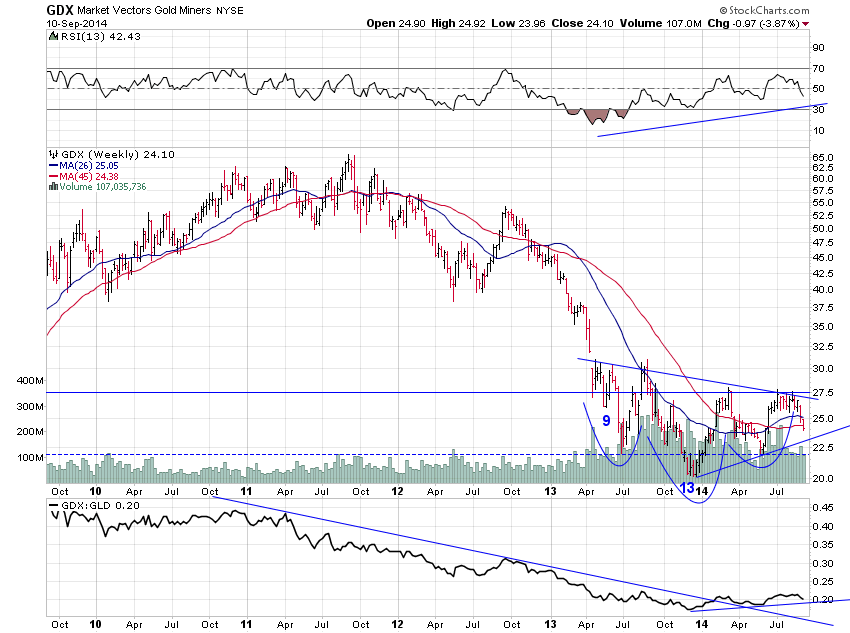
But at the bottom of the chart I’ve included the ratio between the miners ETF and the gold ETF. After underperforming the metal for the past three years or so the miners have recently begun to outperform. If their underperformance back in 2011 was a warning signal that gold’s bull run was coming to an end (and it was) this recent outperformance could mean the bearish trend of the past few years may soon be ending, as well.
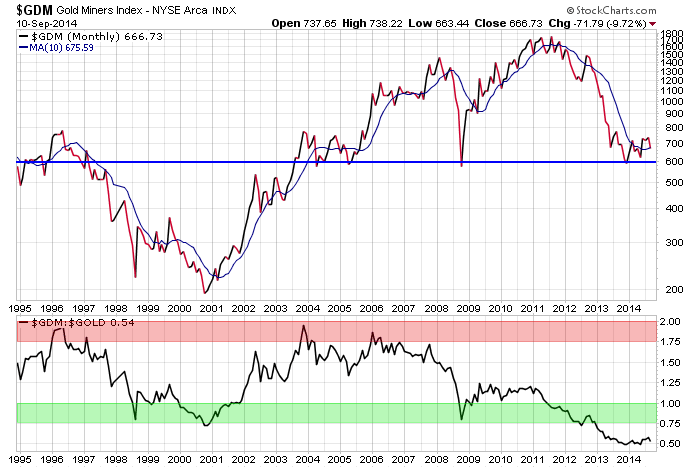
And a longer term look at the ratio between the miners and the metal (at the bottom of the chart below) shows the miners have not been this cheap relative to the underlying metal at any point during the past twenty years.
Finally, not only are portfolio managers extremely underweight the precious metals right now, individual investors have pretty much abandoned them, too.
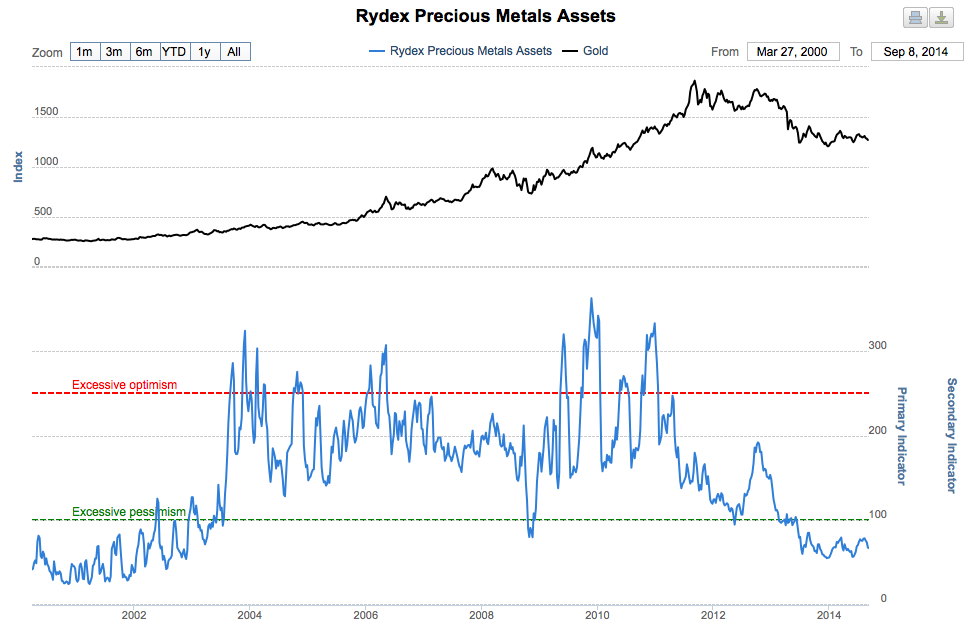 Chart via SentimenTrader
While the so-called dumb money gives up on the trade, the smart money is getting aggressive on the long side. George Soros nearly doubled his position in the gold miners ETF last quarter to over two million shares. He also bought call options on the gold ETF equivalent to about 1.33 million shares.
For those of you who fall in the gold bug camp, the technicals and sentiment may finally be aligning in your favor once again. Stay tuned.