This is part 3 in my market timing series that began with “How To Time The Market Like Warren Buffett”:
“…the big money… is not in reading the tape but in sizing up the entire market and its trend.” -Jesse Livermore, Reminiscences of a Stock Operator
That’s exactly what I’ve been doing with my market timing series over the past few weeks: “sizing up the entire market.” But I haven’t yet gotten to the “trend” part – which, as Jesse testifies, is absolutely critical.
Before I get to that let’s just briefly recap how we got here. I first looked at Warren Buffett’s favorite valuation yardstick to get an idea of how stocks were valued. Comparing the prospective return from stocks (as forecast by the market cap-to-GDP model) to the simple yield on the 10-year treasury note gives us a great idea of which asset class we should own at any given time: the one the offers the greater prospective return! Voila, we have a very successful market-timing model. (See “How to Time The Market Like Warren Buffett“)
Then I looked at a measure of investor sentiment as the basis of a similar model. When I wrote it, I used Buffett’s famous ‘fear and greed’ quote. Since then, however, I really think this one from Sir John Templeton is even more apt: “Help people. When people are desperately trying to sell, help them and buy. When people are enthusiastically trying to buy, help them and sell.” Anyhow, this model worked in a very similar manner to our fundamental model and both had similarly successful results. (See “How to Beat The Market By Being Fearful When Others Are Greedy“)
At the end of the day, the thing that made both of these models successful was helping our hypothetical market timer avoid major bear markets. Where they suffered was when they got our market timer out of stocks (or back into stocks) too early (something that is all too common for the fundamentally-focused investor like yours truly). This is where the trend comes in.
Inspired by the likes of Meb Faber, Cliff Asness and Michael Covel, I’ve been studying trend following for a few months now. Maybe the most common indicator of the intermediate-term trend (1-3 years) that I’ve found is the 200-day moving average. This is simply the average of the last 200 days’ closing prices. A closing price above the average signals an uptrend; a closing price below signals a downtrend.
Many studies have shown that when an investor simply adds a trend-following component to their portfolio using this indicator for the S&P 500 they can reduce drawdowns, aka losses during bear markets, and improve overall results. Depending on transaction costs and taxes, however, the benefits may be negligible. But because I prefer a more holistic approach, I decided to look at what would happen if our hypothetical market timer added this simple trend-following approach to our existing models.
Here’s how it works. Our hypothetical market timer annually (at year-end) checks the 10-year forecast returns provided by our fundamental and our sentiment models and compares them to the yield on the 10-year treasury note. If both models suggest stocks offer the best return she does nothing; she merely holds the stocks she already owns. Should one of the models, however, suggest that the 10-year treasury offers a better return she… doesn’t sell her stocks and buy bonds just yet.
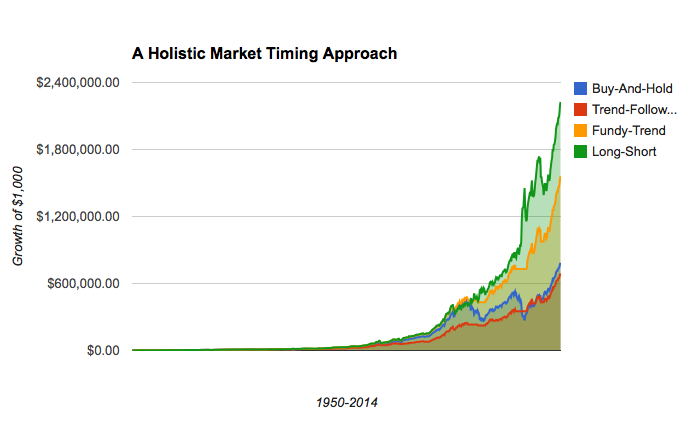
This is where she becomes a trend-follower. On a monthly basis, she begins checking the S&P 500’s 10-month moving average (roughly the same as the 200-dma but easier for me to calculate with the data available) and watches for a close below that level. Should the index close below its 10-month moving average while one of our models suggest stocks are not attractive she shifts from stocks to cash. Here are the results. This strategy is in yellow, labeled “Fundy-Trend.”
 So from 1950-2014 our buy and hold investor turns $1,000 into $785k (if she can hang on through the big drawdowns). Our straight trend-following friend finishes with $690k (using the method Jeremy Siegel uses in “Stocks For The Long Run“). Our fundamental market timer finishes with $1.56 million (compared to $1.15m for our fundamental model and $1.25m for our sentiment models alone), almost twice as much as the buy and hold investor.
Not bad, eh? But what’s that green one that’s over $2.2m?! Well check this out: I also decided to see what would happen if our hypothetical market timer, instead of going to cash, decided to shift from owning stocks to getting short stocks once the trend turned down. Clearly, she kicks everyone’s ass. She makes nearly 3x as much as our buy and hold investor, 2x as much as our simple fundamental and sentiment market timers and more than 40% more than our holistic (fundamental, sentiment and trend) market timer.
Warren Buffett, Sir John Templeton and Jesse Livermore weren’t successful for no reason. They individually used fundamentals, sentiment or the trend to crush the markets. Putting them together into a simple, quantitative and holistic process yields similarly spectacular results. So don’t buy the buy and hold line of BS if it doesn’t suit you. There are systematic ways like this to protect yourself from large losses and enhance your overall returns.
Soon I’ll be putting up a page on this site to keep track of these models. But again, I’d like to emphasize that this is merely for educational purposes. It doesn’t include transaction costs or taxes which should be major considerations for real-world investing scenarios.