
The chart above comes from a recent Liz Ann Sonders presentation. It’s part of her argument that the bull market in stocks is still alive and a bear market is not forthcoming.
When I first saw it I thought there’s no way she can seriously put “x’s” in the “Current” column without any explanation when, in fact, there should be check marks in many if not all of them. Let’s take them one by one.
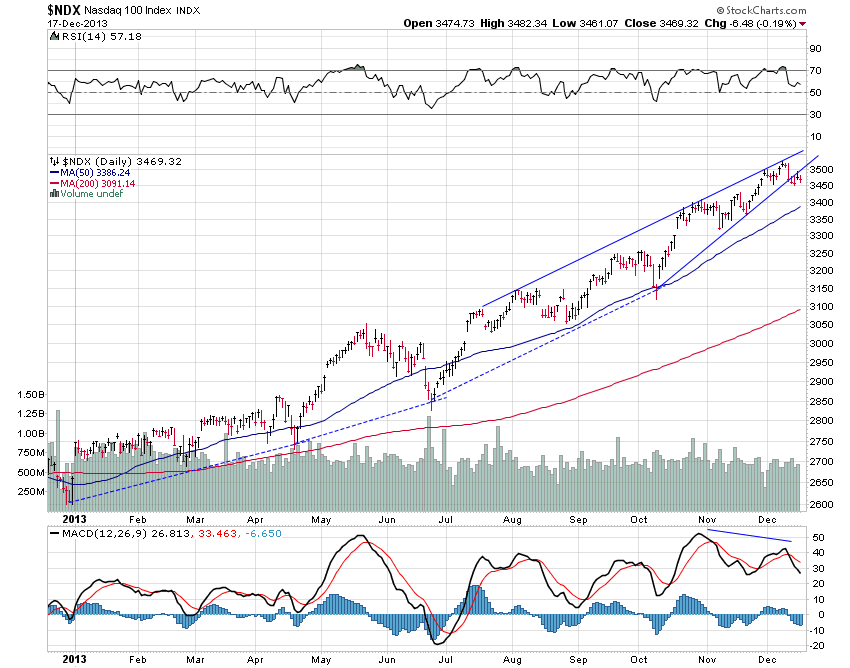
1) “Blow-off Top” – She claims we haven’t witnessed one like we did in 2000 and 2007. Has she even looked at a chart recently? The stock market has soared this year as the Nasdaq has literally gone parabolic:
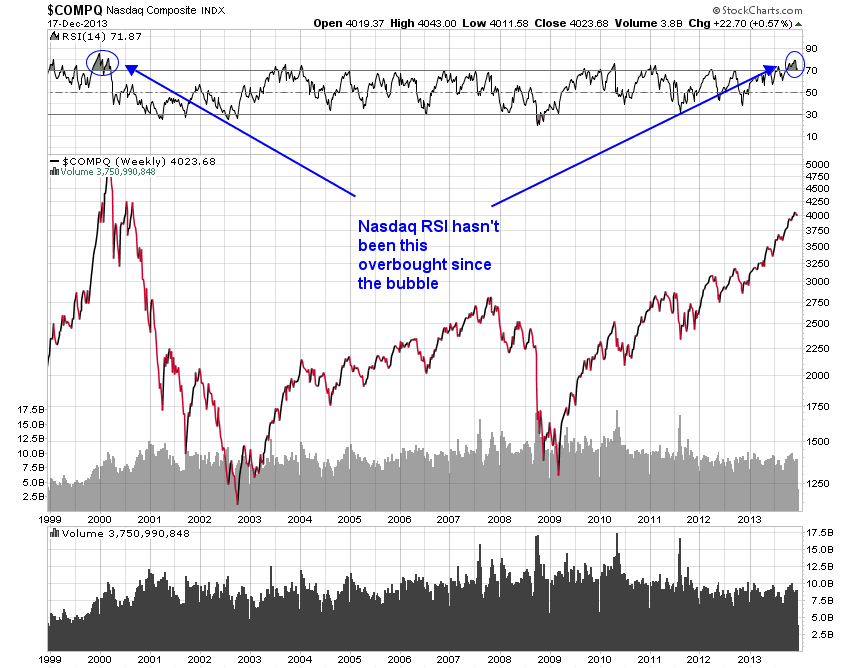
 It’s true we haven’t seen the quick reversal yet that marks a “blow-off” but the Nasdaq hasn’t been this overbought on a weekly time frame since the internet bubble:
 Technically, it can’t be termed a “blow-off” before we see a reversal but it’s just too soon to tell. So far we have witnessed the ideal setup (parabolic rise) for one.
Bottom line: Too early to call
2) “Heavy inflows into equity market mutual funds” – She really has an “x” in this column? Investors have poured more money into equity mutual funds this year than any other time since 2000. If she put an “check” in the 2007 column when inflows were much smaller than today surely we need an “check” in the “current” column.
Bottom line: CHECK
3) “Big pick-up in M&A activity” – Liz has an “x” here, as well, though it’s not that simple. M&A activity is up nearly 40% this year over 2012 to levels not seen since before the financial crisis. Is 40% year-over-year not “big,” Liz? 3rd quarter M&A activity was the highest since Q3 2000!
Bottom line: CHECK
4) “IPO activity” – Again, Liz, you have an “x” even though IPO activity hasn’t been this strong since the internet bubble! From the Wall Street Journal last week:
 Bottom line: CHECK
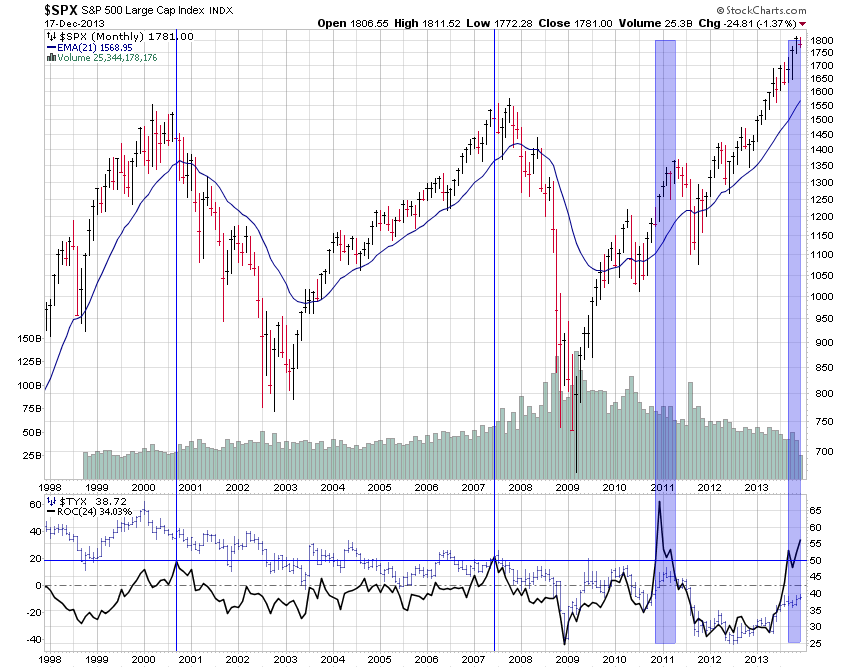
5) “Rising real interest-rates” – Hard to deny this one. Past surges like the current one have consistently led to stock market peaks in the past:
 Bottom line: CHECK
6) “Weakening upward earnings revisions” – Ahem:
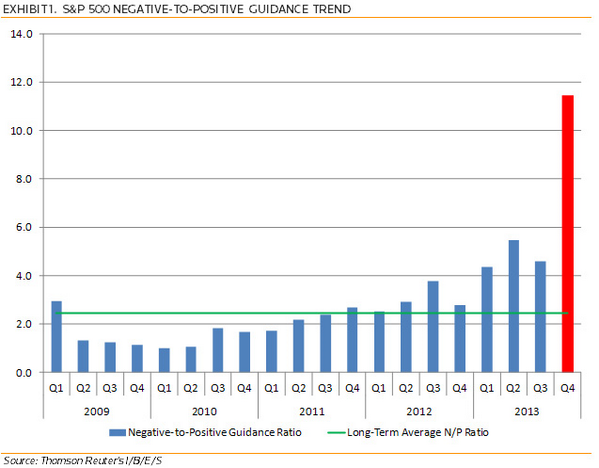 Last quarter was the worst forward guidance Reuters has ever seen. Period.
Bottom line: CHECK
7) “Erosion in number of stocks making new highs” – Let’s have a look:
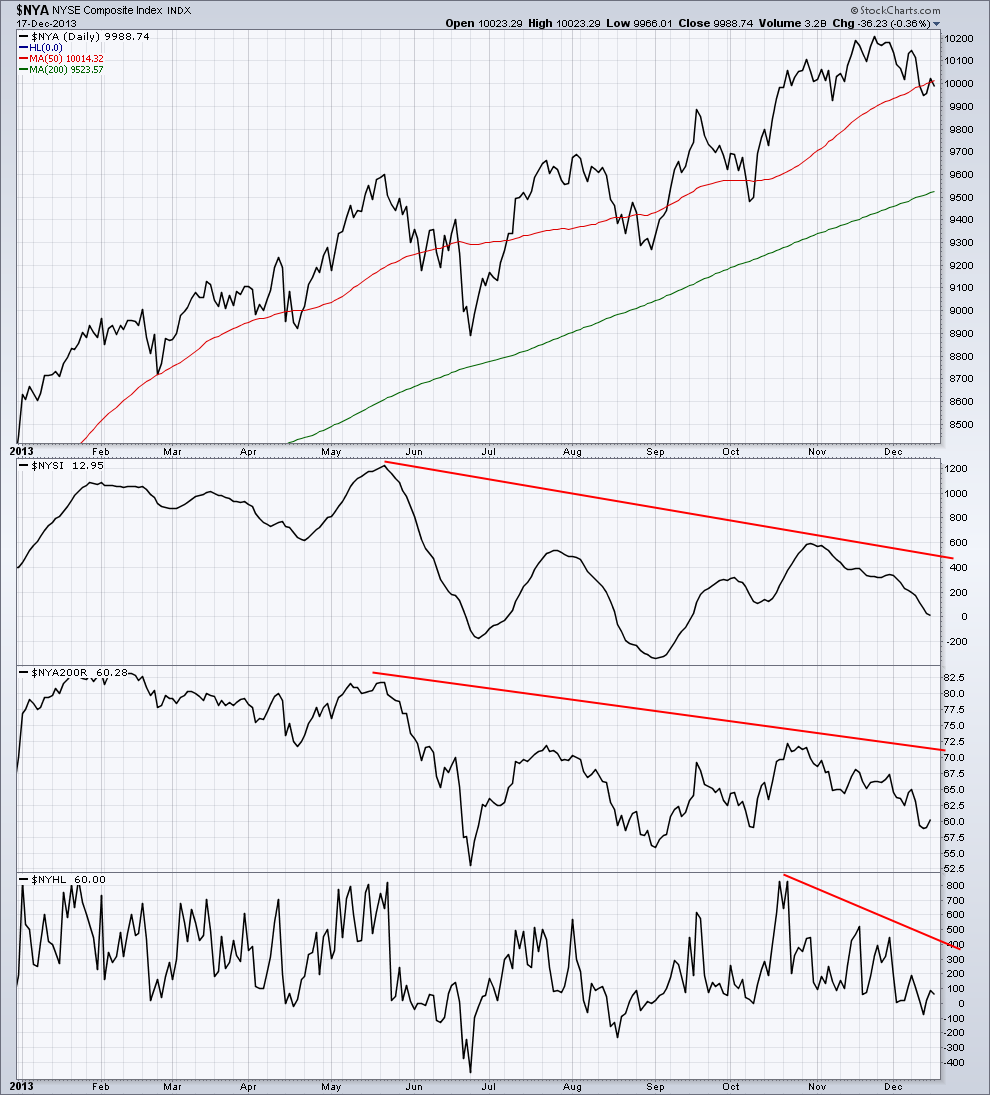
 Both the NYSE and Nasdaq have seen general breadth (including new highs) deteriorate for months while prices have continued higher.
Bottom line: CHECK
8) “Shift toward defensive leadership” – This one is a bit harder to quantify. I think of defensive stocks as consumer staples, those that pay dividends, etc. Both have performed far better than average this year though they haven’t outperformed the S&P 500 which is what I think Liz is looking for.
Bottom line: Too close to call
9) “Credit spreads moving in wrong direction” – Here Liz is right. We haven’t seen credit spreads widen at all recently:
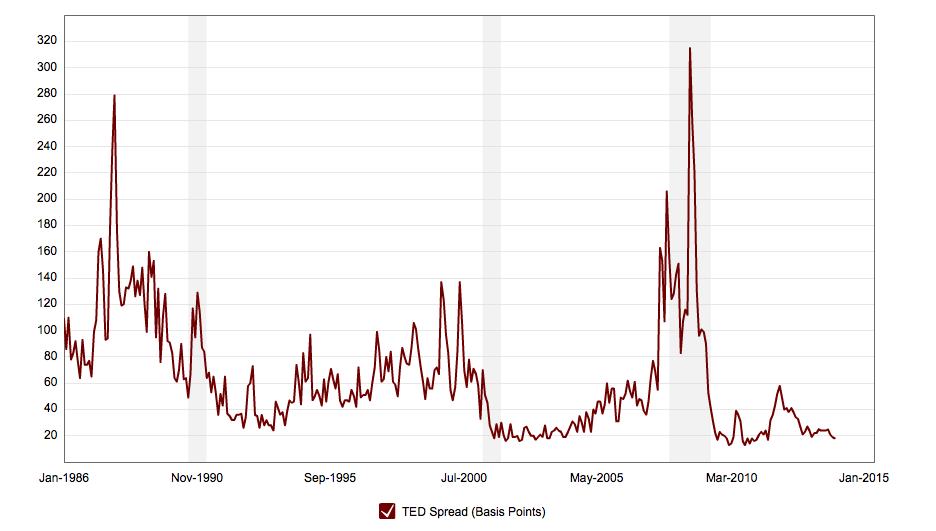 Now I’m no expert in these matters but it looks like credit spreads in this chart have been pretty darn quiet since QE was first initiated. It could be that spreads are being artificially depressed by the Fed’s manipulation of the bond market via QE. I don’t think there’s any real way of knowing.
Bottom line: X* (asterisk for potential effects of QE on spreads)
All in all, it looks to me like Liz’s “stock market top” checklist is a lot more bearish than she would have us believe.
UPDATE: I should clarify that Liz Ann Sonders did not personally prepare the checklist (Strategas did); she merely presented it here.