There has been a lot of discussion lately about how best to value the stock market. Do we use Nobel Laureate Robert Shiller’s CAPE model? Do we use Warren Buffett’s market cap-to-GDP model? Price-to-forward or trailing earnings?
There are all kinds of valuation methods we can look at. In fact, there are so many that based upon your own personal bias you can undoubtedly find one that supports your position, whether you believe stocks to be incredibly cheap or extremely expensive.
Last week Josh Brown shared the chart below which suggests that most measures show stocks are cheap:
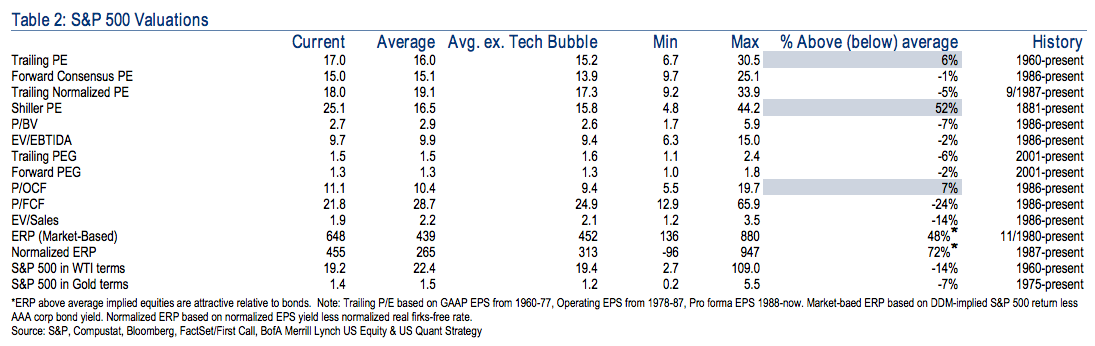
The problem with this is that most of these indicators only go back to 1986! That barely covers more than a couple of complete market cycles.
Think stocks are cheap? Maybe compared to the bubble days… pic.twitter.com/dLBItM02Rt
— Jesse Felder (@jessefelder) December 13, 2013
Of course, if we look just at recent history, stocks are going to look pretty cheap because recent history includes a couple of the largest financial bubbles in human history. In relation, today’s valuations look like a bargain. It’s like a retailer who marks an item’s list price up 200% and then advertises a 50% discount. It sounds cheap even though it’s really still a 50% markup from the original price.
To get real perspective on valuations we have to look at data that includes more than just one or two complete cycles. And like anything else, the more data (time and cycles) we have the more accurate our analysis can be. This is one reason the CAPE, or Shiller p/e, is so popular; it incorporates over a century worth of data:
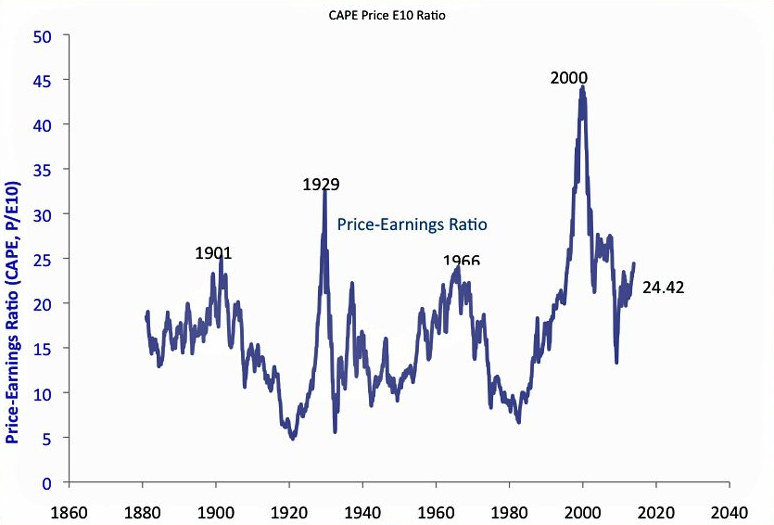
Based on this model stocks aren’t nearly as expensive as they were during the 2000 internet bubble but they are also about 50% more expensive then their average over the entire time. But this is only one measure. If more data gives us a more accurate picture then we should look at other methods as well.
In addition to prices relative to earnings we can look at prices relative to revenues:
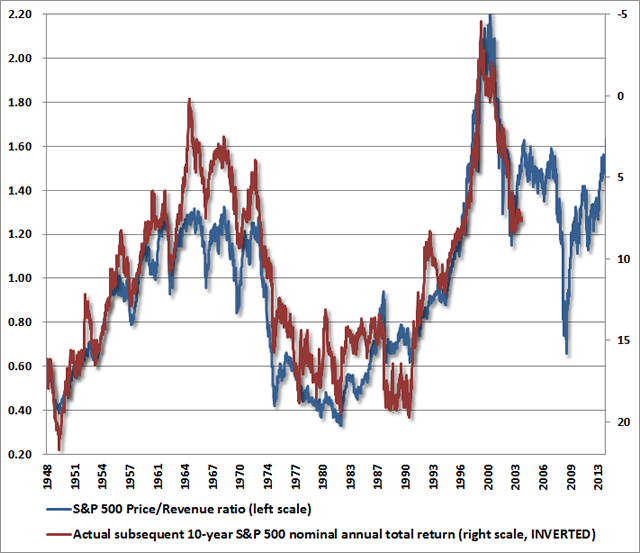
Again, stocks look expensive – not as expensive as during the bubble but very expensive relative to 65 years worth of data. (What’s nice about the chart above is that it is very predictive: it correlates very closely with subsequent equity returns.)
A third measure to consider is stock values relative to their assets:
This measure also shows that stocks have rarely been as highly valued as they are today. And that makes three different measures (price-to-earnings, price-to-sales and price-to-assets), each with over 65 years worth of data, that suggest current stock valuations are much higher than average.
Bulls will say that the CAPE is inflated because of the earnings depression during the financial crisis. They will say that we shouldn’t include data from the Great Depression because it doesn’t apply to modern times. They will say Warren Buffett’s favorite valuation tool is compromised because companies now earn more overseas. They will come up with all kinds of reasons why these measures are no longer valid. But this is a common refrain:
Frankly, most debates about valuation methods can be easily settled by the data, but the same arguments emerge at every market top: “It’s different this time. The critics are wrong. Profit margins are fine. Valuations should be higher. And stocks are going up.” It’s a useful reminder that what may have been an unsettled debate on these points in 2007 was quickly followed by a 55% plunge in the stock market, and in 2000 by a 50% plunge. –John Hussman
The fact that there is a debate at all should be a warning in itself. Investors only need to rationalize the data like this when they have become irrationally bullish. Rational investors would do well to take heed.