About six weeks ago I wrote that I thought it was time to sell long-term bonds (and buy stocks and the Euro). Since then the charts have started looking even more convincing in this regard.


To be sure, the very long-term trend of declining rates is a strong one. It is still clearly in force and will be until the upper trend line on the chart below is broken:

It will take a very dramatic uptick in interest rates to even touch that upper trend line, now sitting at the 4% level, and the price of the 10-Year Treasury Note would get absolutely hammered in the process (because prices move inversely to yields).
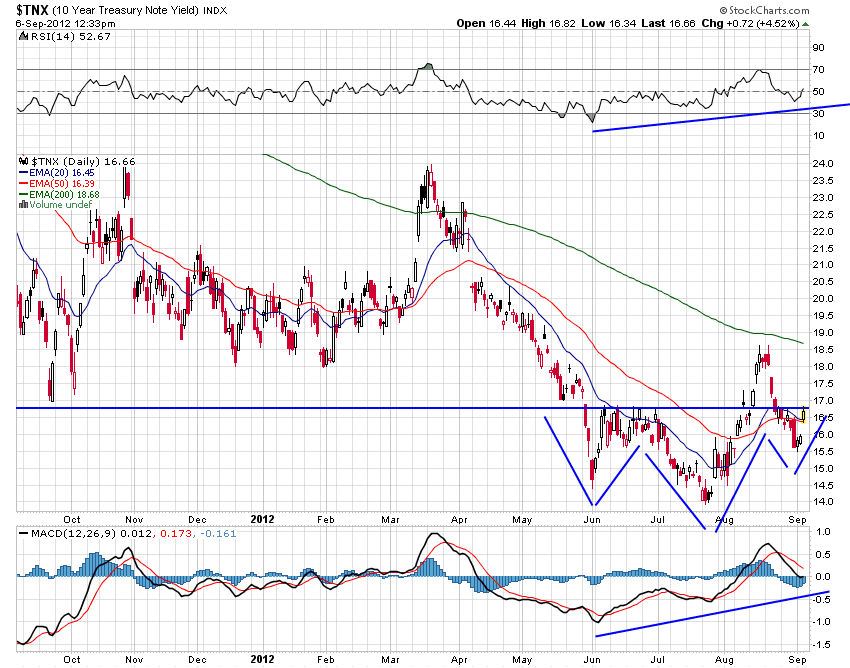
Still, it looks like we may be witnessing the beginning of the end of this trend. The daily chart show a classic bottoming pattern, an inverse head and shoulders:
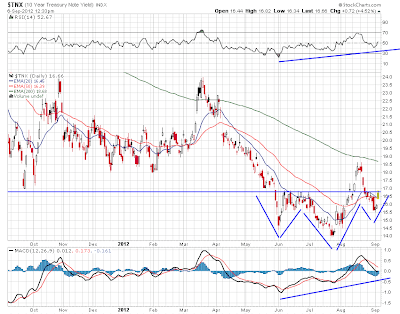
The weekly chart also shows a classic bottoming pattern, the descending wedge or ending diagonal. Notice the bullish divergences in RSI and MACD as the price made new lows over the summer:

All in all, it’s very tough to call an end to such a long and powerful trend. Many pundits have been wrong in making this call for years now. So I’m not putting any money on it but I think it’s safe to play defense here and protect yourself, and your investment portfolio, from a potential crash in the bond market.