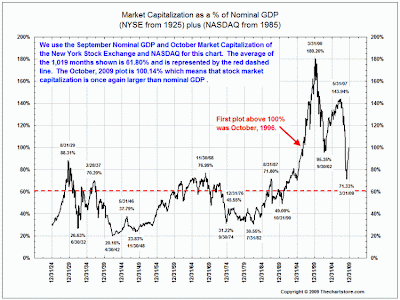
I recently demonstrated that after the recent and massive rally in the stock market, stocks are no longer cheap relative to their earnings. Today, I came across the chart below (via The Big Picture) which looks at stock market valuation in a different way.
It compares the total value of all publicly-traded stocks to the country’s Gross Domestic Product. This is, in fact, Warren Buffett’s preferred method of evaluating the attractiveness of stocks, in general.

As is clearly evident, the stock market can’t be called “cheap” at present and didn’t even reach historically “cheap” levels back at the lows last March, or 65% ago.
That’s the fundamental picture. However, I try to always marry the fundamental picture with the technical. I’ve been eyeing this next chart for the past couple weeks or so. It delineates the 50% time and price retracement of the bear market decline that began in 2007 (50% retracement is a popular technical measure among traders, especially Elliott Wave enthusiasts). 1121 on 11/21, ironically, is the line in the sand here:

1121 in price is the half-way point between the top (1576) and the bottom (666) of the bear market decline. 257 days is half the time of the decline; November 21st will mark the 257th day from the March 9th bottom. Hence, 1121 on 11/21. Interestingly, this projection lines up nearly perfectly with the bear market downtrend line.
This is not to say this rally will come to an end tomorrow (Saturday, the 21st, is not a trading day). My point is simply that both the fundamentals and technicals are lining up here to suggest caution is warranted.