Back in March I wrote a piece called “The Cheapest Stock Market in Decades” demonstrating what a rare buying opportunity stocks presented at the time. Since then the stock market hast soared an amazing sixty percent. Obviously, then, stocks aren’t as cheap as they were only six months ago.
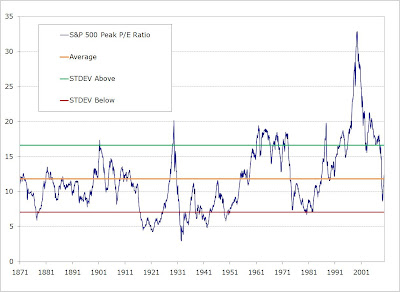
So let’s take a look at the current value of the S&P 500 in relation to its earnings. The first chart plots the the value of the index in relation to its peak earnings (June, 2007 is the latest high water mark):

The chart above shows that stocks briefly dipped below their average valuation over the past century but the recent rally has resulted in stocks, yet again, becoming overvalued. It also demonstrates that stocks never saw the degree of undervalution that they witnessed in the previous, major bear markets (i.e. 1973-74 and 1930-31).
This next chart plots the price of the S&P 500 to its 5-year average trailing earnings:

It shows a very similar picture to the prior chart. Stocks never reached a standard deviation below average valuation during the last bear market.
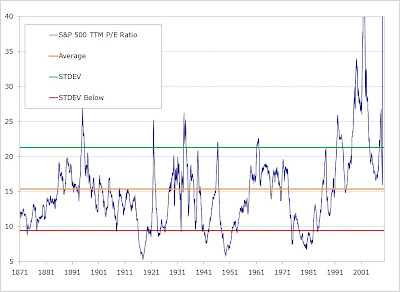
And finally, the S&P price relative to its actual, trailing twelve months’ earnings:

The current reading is literally off-the-charts. This is due to the fact that the recent earnings collapse is the most dramatic on record (current earnings of roughly $7.5 for the index result in a current price to earnings ratio of 140: 1050/7.51 = 140). Earnings for the S&P 500 over the past couple of years have dropped over ninety percent. This is significantly worse than the seventy-five percent decline in earnings experienced during the great depression.
The earnings crash of the great depression caused a bear market in stocks which saw valuation remain below average for roughly twenty years. In contrast, despite an even more dramatic decline in earnings stocks have recently spent a mere eleven months below fair value and are now back above this level.
Put another way, after spending over twenty years trading above fair value encompassing the largest bubble in stock market history during which stocks traded over three standard deviations above their long-term average valuation, the recent reversion has only resulted in a brief dip into the realm of undervaluation in which stocks never even saw a full standard deviation below average.
One would reasonably expect that the biggest bubble in history should be followed by a similarly significant decline or reversion. Even if it only rhymes rather than repeats, history demonstrates this to be true. The 1930-31 and 1973-74 bear markets saw stock market undervaluation persist for at least a decade or two and, on more than one occasion during each bear market, saw valuations at least one standard deviation below average.
Hence, from a fundamental perspective, I believe it is reasonable to expect stocks to return to an undervalued condition that persists much longer than the eleven months we recently witnessed. In addition, it is not unreasonable to expect stocks to reach a valuation at least one standard deviation below average just as they have in prior, major bear markets.
Source:
Online Data Robert Shiller
http://www.econ.yale.edu/~shiller/data.htm