The market has now broken down out of the head and shoulders pattern I wrote about earlier this month, leading to the worst June for the Dow Jones Industrial Average since the Great Depression.
From the chart above you can see that the decline projected by the pattern has been fulfilled (and then some). This is the type of action that I anticipated would call for patience in the short-term.
Now that our patience has been rewarded, I’ve written over the past week or so that it seems that the negativity has gone a bit too far. This next chart shows just how far.
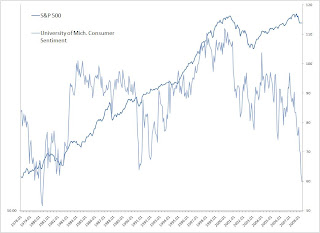
This is a chart of the S&P 500 going back to 1978. Overlayed on top of the stock index is the University of Michigan Consumer Sentiment Index which currently shows the most negative reading in nearly 30 years.
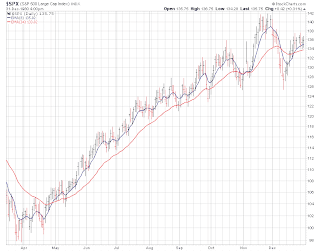
There are only 2 months in the past 366 that have shown a lower reading than today’s: April and May 1980. Spring 1980 was actually a pretty good time to be realistically optimistic as the stock market gained about 40% over the following 6 months:
Now I realize that “History does not repeat itself, but it does rhyme” so I don’t expect 1980 all over again. I do believe, however, that the current panic should be viewed for what it is: a rare opportunity.


