I’ve been following the progress of Bank of the Cascades (CACB) with earnest over the course of the past year or so, mainly because I think it is one of the best gauges of the health of the local real estate market and hence the local economy.
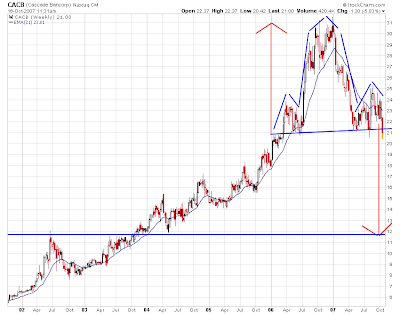
Although the company hasn’t reported 3rd quarter financials yet, the weekly chart of the stock price is so intriguing I can’t resist updating my chronicles of CACB. The chart pattern below is about as textbook a head and shoulders pattern as you’ll ever see.

This classic topping pattern usually predicts a fall roughly equal to the height of the head from the neckline, roughly 10 bucks in this case. If the stock follows this script that would put it back to the support/resistance line right around 11/12. Fundamentally, my guess is this would require the bank putting up some ugly numbers.
Like I said before, the company hasn’t yet reported its numbers but the stock price is suggesting that Patty Moss’ baby ain’t looking too good.
LIV