In these pages over the past months I’ve written much about the fundamental problems facing most asset classes including bonds and real estate in addition to equities. Now, I believe, there is ample technical evidence to corroborate the fundamental case for caution.
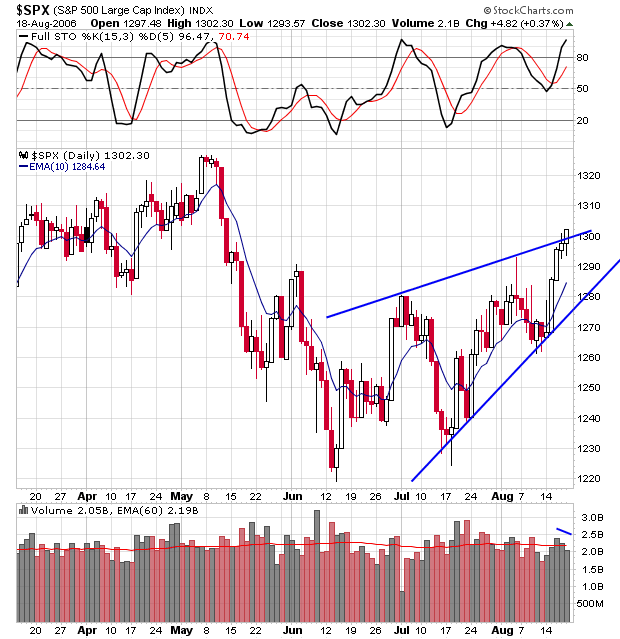
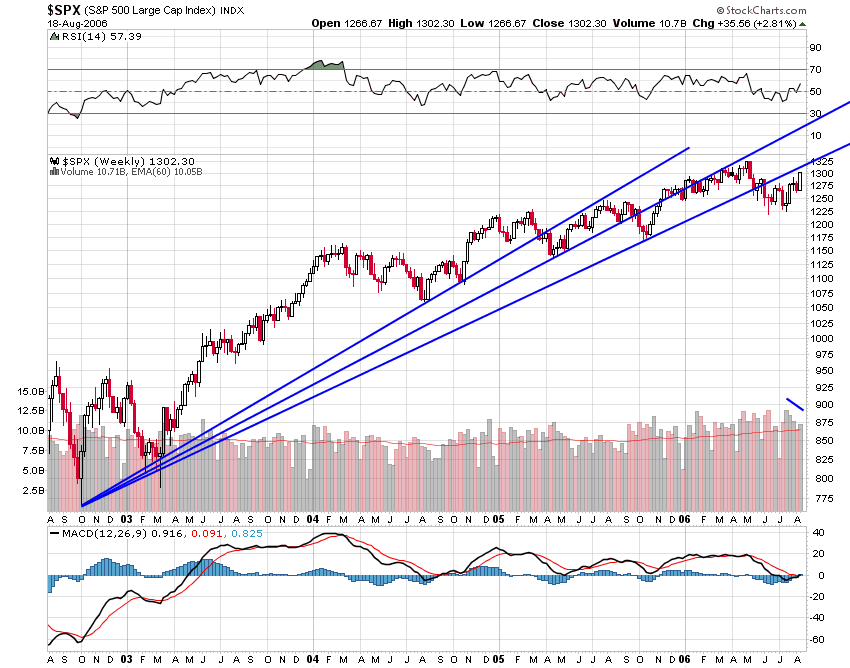
Since mid-June the S&P 500 has managed to regain a large portion of what it lost in the late spring decline. However, the price action appears to corrective rather than the start of a new bull run. The clear wedge on the chart shows, according to Edwards and Magee in their classic book “Technical Analysis of Stock Trends,” “a gradual petering out of investment interest. Prices advance, but each new up wave is feebler than the last. Finally, demand fails entirely and the trend reverses. Thus, a Rising Wedge typifies a situation which is growing progressively weaker in the technical sense.”
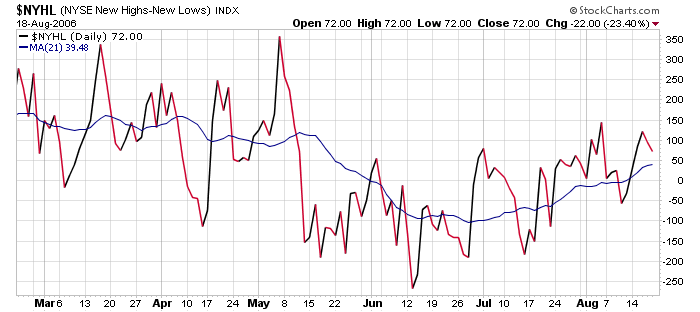
In addition, many divergences with prices are also suggesting that this rally may be nearing an end. The amount of net new highs on the New York Stock Exchange has not kept pace with the index.

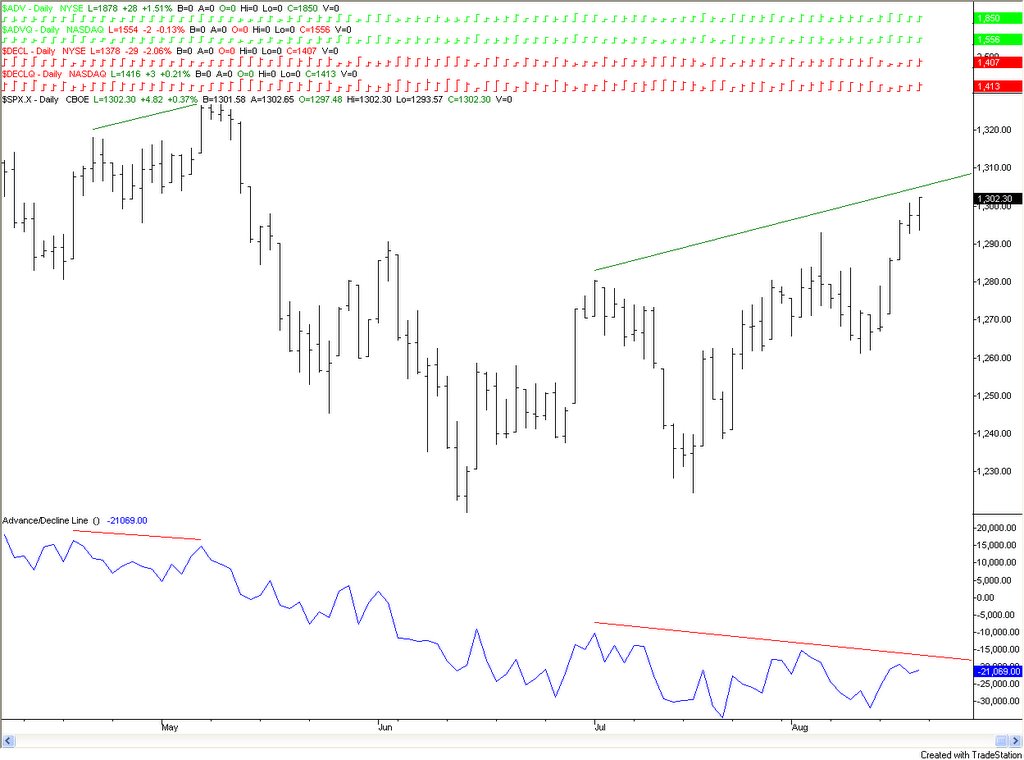
The Advance Decline Line (a measure of the market’s breadth) is also not confirming the recent strength in prices just as it failed to confirm the May highs.
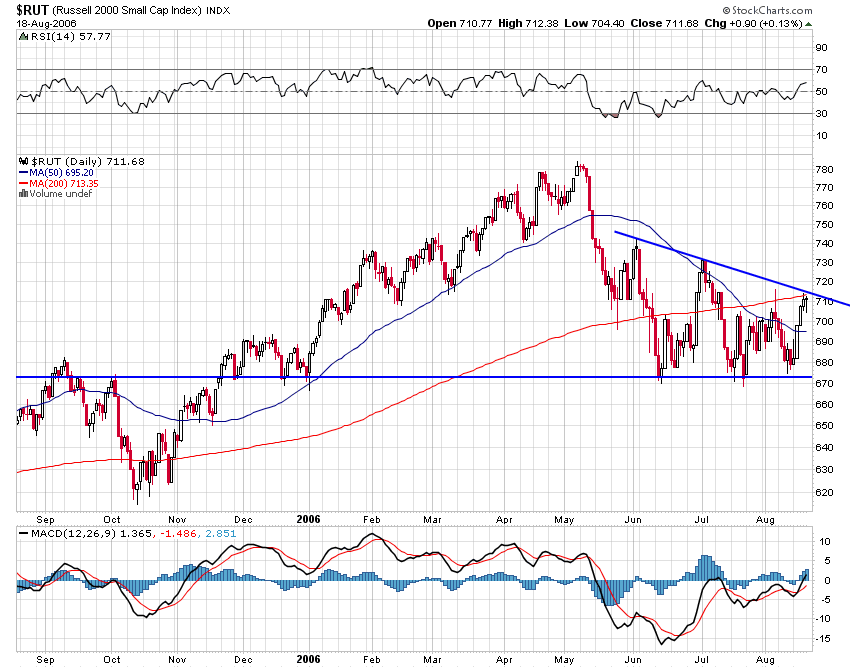
A big reason for these divergences is the fact that small cap stocks, which have lead the market in recent years, have been lagging dramatically behind their larger cap brethren in this latest rally. This is fairly obvious when looking at a chart of the Russell 2000. What is a little less obvious is the bearish pattern in this index, a descending triangle. The pattern, according to Murphy’s popular, “Technical Analysis of the Financial Markets,” is, “generally considered a bearish pattern… This pattern indicates that sellers are more aggressive than buyers, and is usually resolved to the downside.”
So the market leaders are now laggards. What once was strong, now is weak. The fact that investors currently prefer the blue chips is, in and of itself, a sign that risk is being shunned. This is not the mindset that drives bull markets.
Another measure of investor sentiment, The CBOE Volatility Index, is also indicating prices may have little upside left as it recently registered a sell signal.
Thus the short-term climate is not quite amenable to continued gains in stock prices. But what concerns me even more are the larger signs of trouble.
Longer-term, there are a few indicators that suggest the bear may be reemerging from hibernation. The S&P 500 Index has now broken 3 fan lines, which, according to Murphy, is a, “valid trend reversal signal.” In other words, the bull market trend that began in 2003 is over.
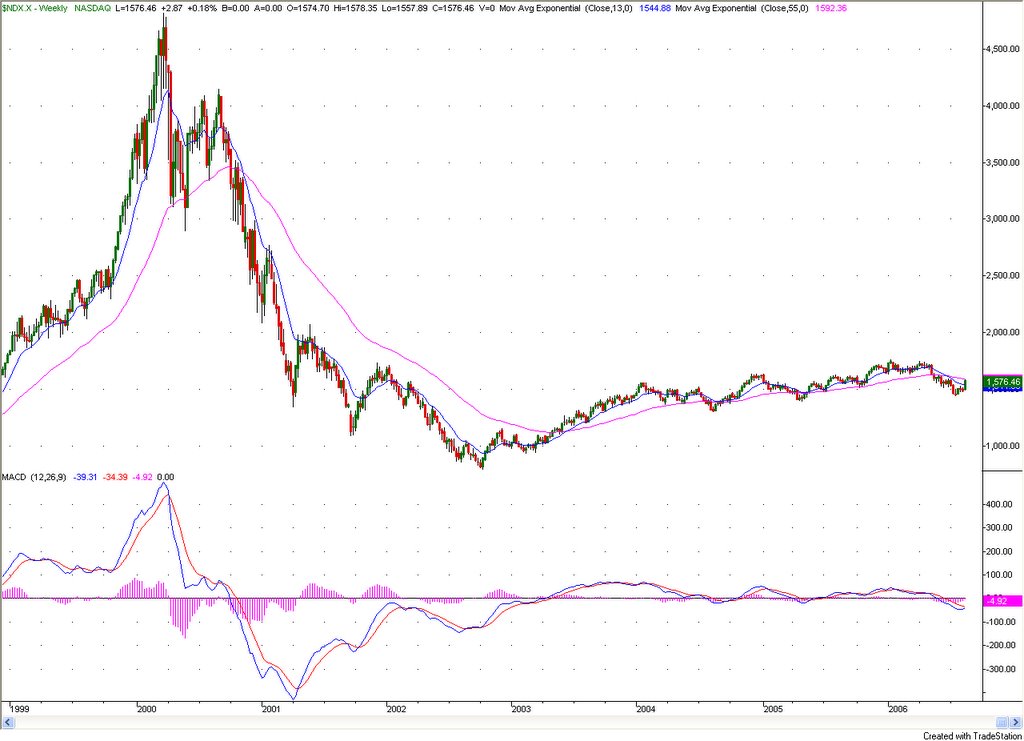
Turning to another of the major indexes, the Nasdaq Composite, we can see another important trend reversal signal. See if you can find the last time these two moving averages difinitively crossed. That’s right, Fall 2000, the beginning of an 80%+ decline in this index in two years time. (Click on the chart for a better view. If you look carefully you can also see a bearish “ascending wedge” that formed after the initial decline from the March 2000 peak, similar to the one that can now be seen in the S&P.)
In a seminar I attended last Summer with Tom DeMark, he noted, in a rather Yogi Berra-ish way, that, “tops are made by the last buyer buying.” Right now mutual fund cash levels suggest that there may not be many more buyers to follow those that were active in May. In fact, funds are carrying less cash in their portfolios as a percentage of total assets than they did at the peak in 2000.
All of this strongly suggests that it’s time for investors to err on the side of caution. Combined with the many fundamental issues facing the major asset classes today, the technical landscape suggests the bear may be back.
LIV