This stock market is now the second most overbought, the second most overvalued and most most over-leveraged market in history.
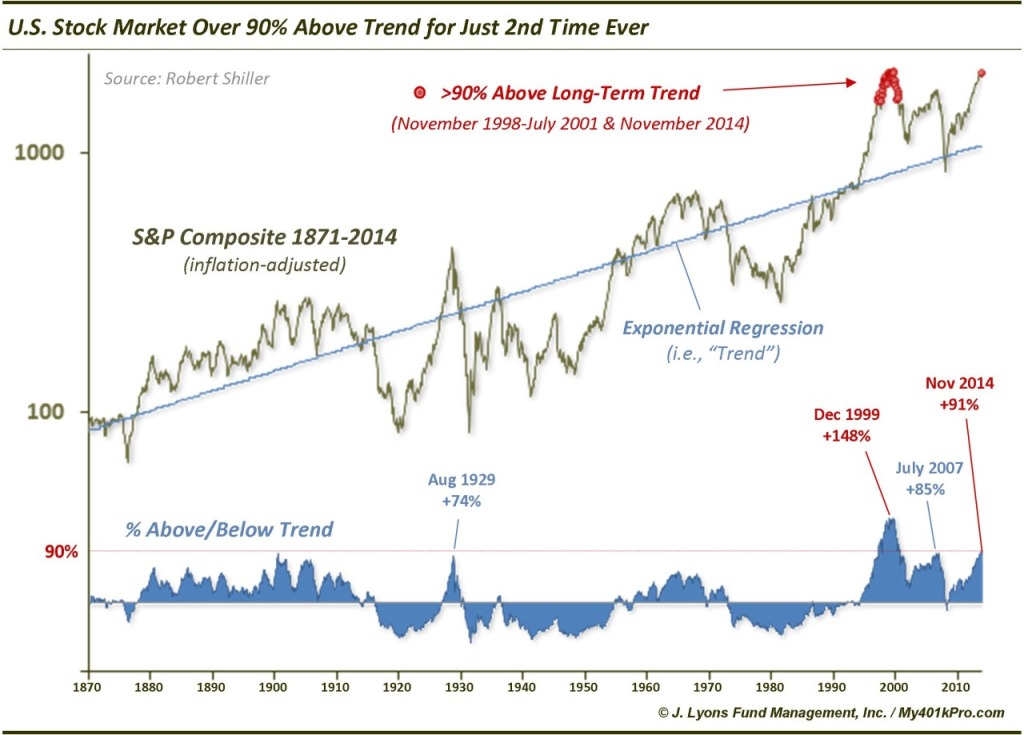
Overbought: My friend, Dana Lyons, recently posted the chart below which shows the S&P 500 in relation to its exponential regression trend line. The only other time in history stocks were this “overbought” (traded more than 90% above the long-term trend) was back at the height of the internet bubble.
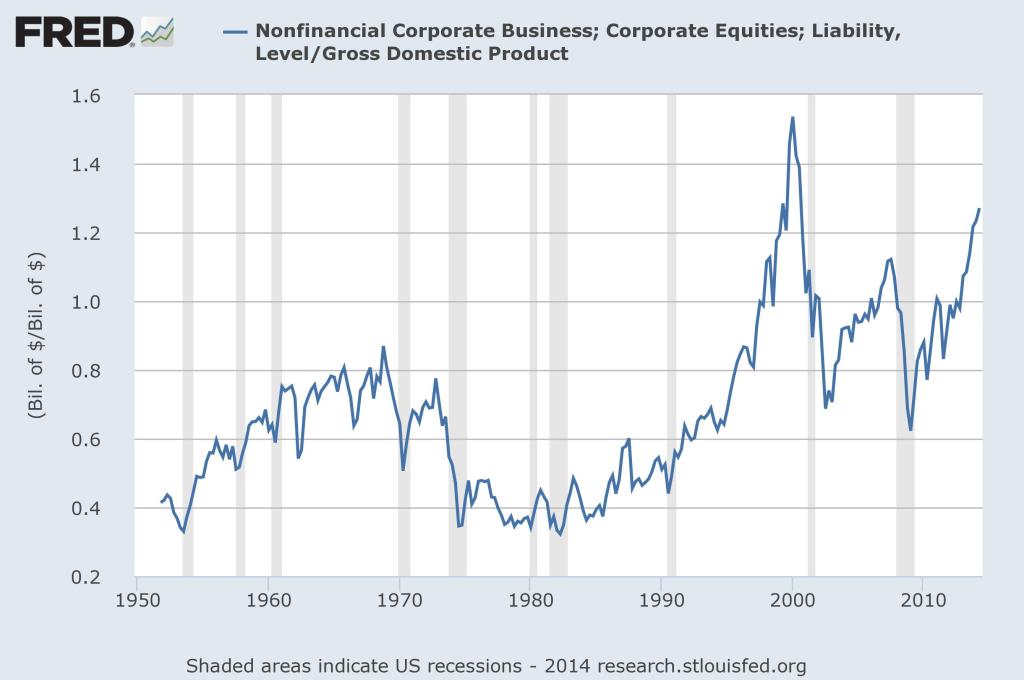
Overvalued: A glance at the chart below, of Warren Buffett’s favorite valuation metric (total market capitalization-to-GDP), clearly shows that there was also only one other time in history when stocks were priced so dearly as they are today: 1999.
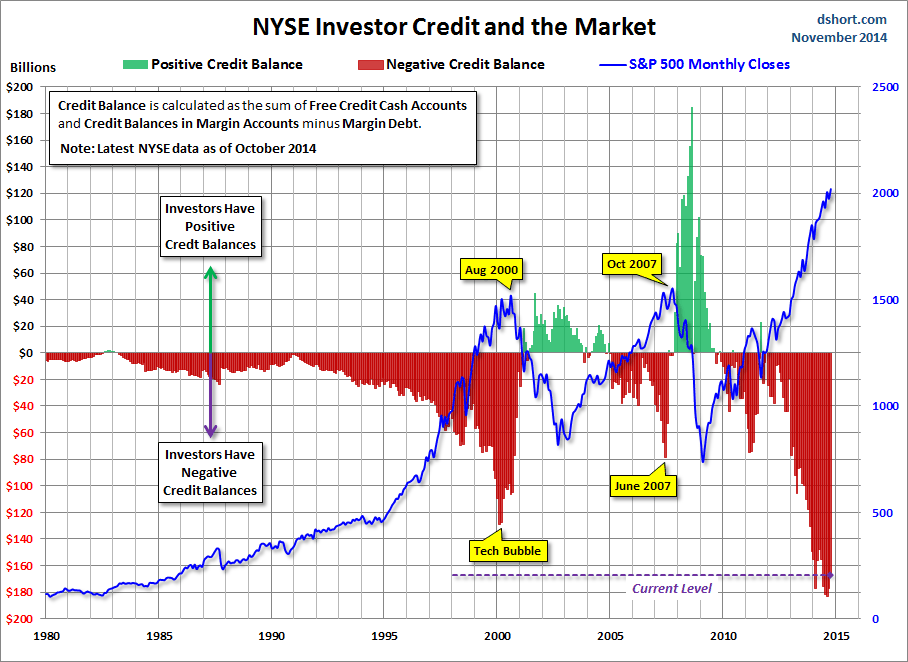
Over-leveraged: Finally, investors have never been so highly levered to equity prices. Even 1999 can’t compare with today’s aggressiveness. As the next chart shows, net free credits (cash minus margin debt) in brokerage accounts have never traveled so far into negative territory as they have now.
I think it’s pretty pointless to debate whether this constitutes another “bubble” or not. Label it however you want. But it’s hard to deny that this is, at the very least, the second most unattractive time to own equities in history. In other words, this is probably the second worst time in history to own stocks.


