The Felder Report
0
Menu
  • Home
  • About
  • Blog
  • Podcast
  • Reports
    • Premium
      • Market Comments
      • Monthly Chart Book
      • Strategy & Positioning
    • Pro
      • Cairns
      • Trade Ideas
  • Model ETF Portfolios
  • Indicators
  • Login
  • Subscribe
  • 0
    was successfully added to your cart.
Close Search

The Coppock Curve

  • June 30, 2025

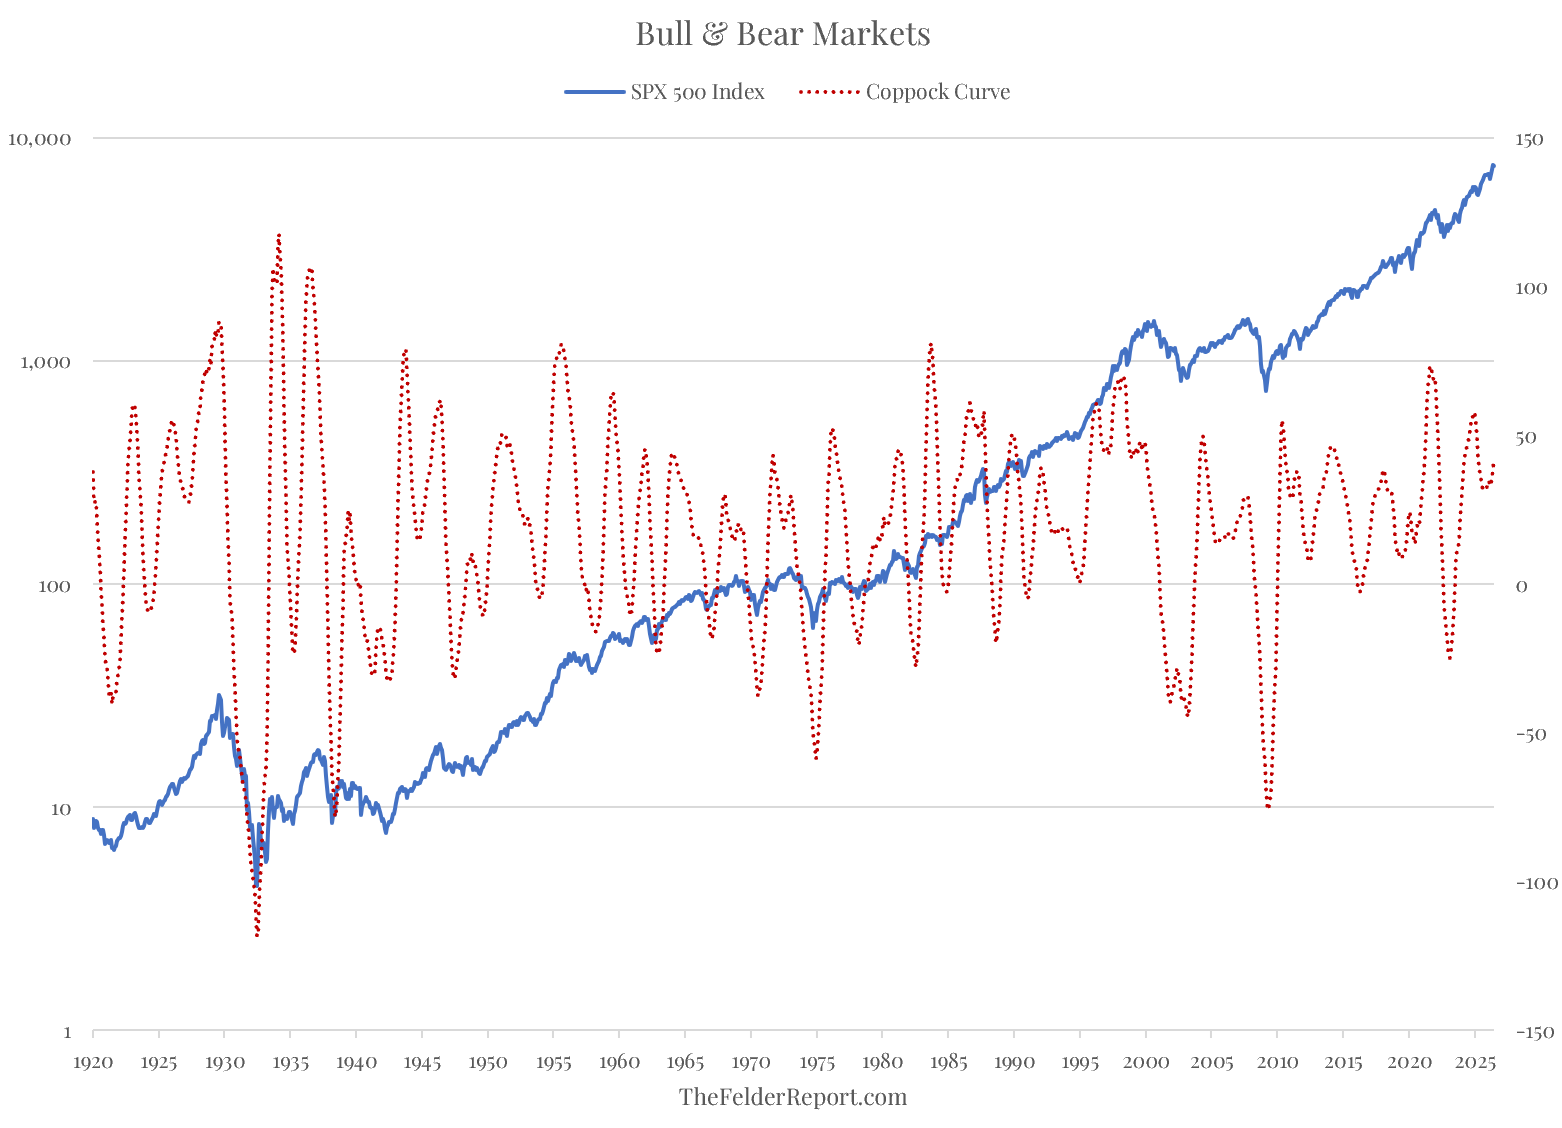
The Coppock Curve is a long-term trend-following indicator developed by E.S.C. Coppock primarily as a method of determining major stock market lows. When the indicator crosses below the zero line and then turns upward from a low point it has regularly marked the end of major bear markets and thus terrific long-term buying opportunities.

  • Previous Project
  • Next Project
Share Share Share Pin

Recent Posts

  • ‘Buy The Dip Has Become The New Religion’
  • Of Big Cons And Ponzi Schemes
  • This Is What ‘Greed’ Looks Like, Part Deux

Archives

My Stuff

My Account

Cart

Contact

FELDER INVESTMENT RESEARCH, LLC
PO Box 100
Gleneden Beach, Oregon 97388

Contact Us

Terms of Use

Privacy Policy

© 2017 FELDER INVESTMENT RESEARCH, LLC, A PERITIVE Powered Design

Close Menu
  • Home
  • About
  • Blog
  • Podcast
  • Reports
    • Premium
      • Market Comments
      • Monthly Chart Book
      • Strategy & Positioning
    • Pro
      • Cairns
      • Trade Ideas
  • Model ETF Portfolios
  • Indicators
  • Login
  • Subscribe