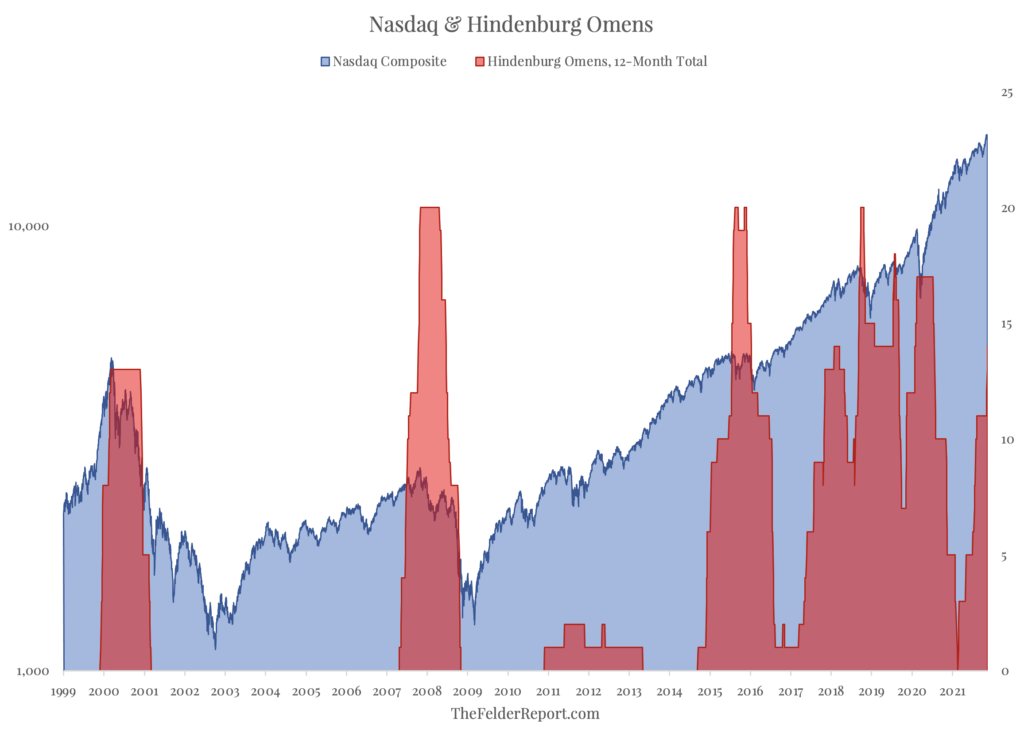
A few months ago, I drew attention to the fact that the Nasdaq was showing signs of increasing dispersion under the surface, a warning regarding the relative health of the uptrend. The following month, the Nasdaq Composite underwent a brief correction of about 8% (from high to low). It has since recouped those losses and then some but these breadth warnings have only continued.
Specifically, I am referring to a signal called the Hindenburg Omen that is triggered when the index sits at or near a new high and both the number of new 52-week highs and lows on the exchange rises above a certain threshold (here are the details). The indicator gets a bad rap as it was originally billed as a signal of an impending crash and has a terrible track record in this regard. The vast majority of signals are not followed by stock market crashes as they occur with far too great a frequency.
Still, I find that tracking the number of signals over certain time periods has a great deal of value at forecasting increasing volatility. The history of the Nasdaq Composite over the past couple of decades is a good example of this. This week saw the index trigger its 13th and 14th Hindenburg Omens of the year. In the past, this degree of persistent dispersion has been a consistent precursor to corrections or bear markets in the index.
In March of 2000, at the peak of the DotCom mania, we saw the index trigger its 13th omen and a bear market ensued shortly thereafter, as did another in 2007-2008, after 13 omens were triggered in October of 2007. It wasn’t until almost eight years later the running total hit 13 again, just prior to a pair of corrections in mid-2015 and early-2016. Then, in late-2017, we saw 13 omens eclipsed again heading into the “Volmageddon” episode in early-2018. 13 proved the magic number once again later that year just prior to the fourth quarter selloff that bottomed around Christmas. Finally, we saw 13 omens triggered again just prior to the Covid crash in early-2020.
| Date | 3M Return | 6M Return | 12M Return |
| 3/7/00 | -21% | -15% | -54% |
| 10/12/07 | -12% | -19% | -34% |
| 7/20/15 | -6% | -14% | -2% |
| 11/7/17 | 4% | 7% | 12% |
| 9/6/18 | -9% | -5% | 2% |
| 1/29/20 | -4% | 14% | 41% |
| Average | -8% | -5% | -6% |
So, at least from the history of the past twenty years or so, it would appear that when dispersion within the stock market reaches a certain level it is a pretty good warning sign of turbulence just ahead. Because that level was crossed again this week, it may be prudent to remain seated and make sure your seat belt is securely fastened, in a metaphorical sense, of course.


