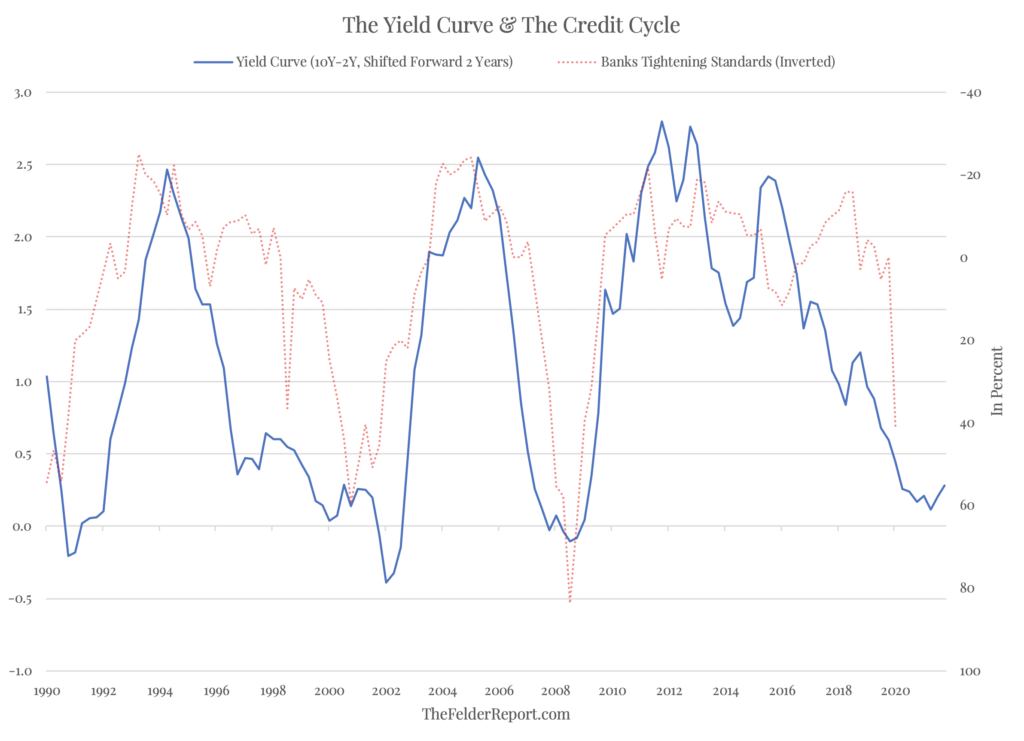
Before the Coronavirus catalyst, there had been a great deal of debate about the yield curve and its ability to predict recession. The yield curve (as measured by the 10-year treasury yield less the 2-year yield) inverted for the first time during the current cycle back in August of last year and now we find ourselves in recession once again, preserving the indicator’s perfect track record.
But it’s important to understand why the yield curve works as a recession signal and also why it typically presages a high-volatility market environment. It comes down to the credit cycle.
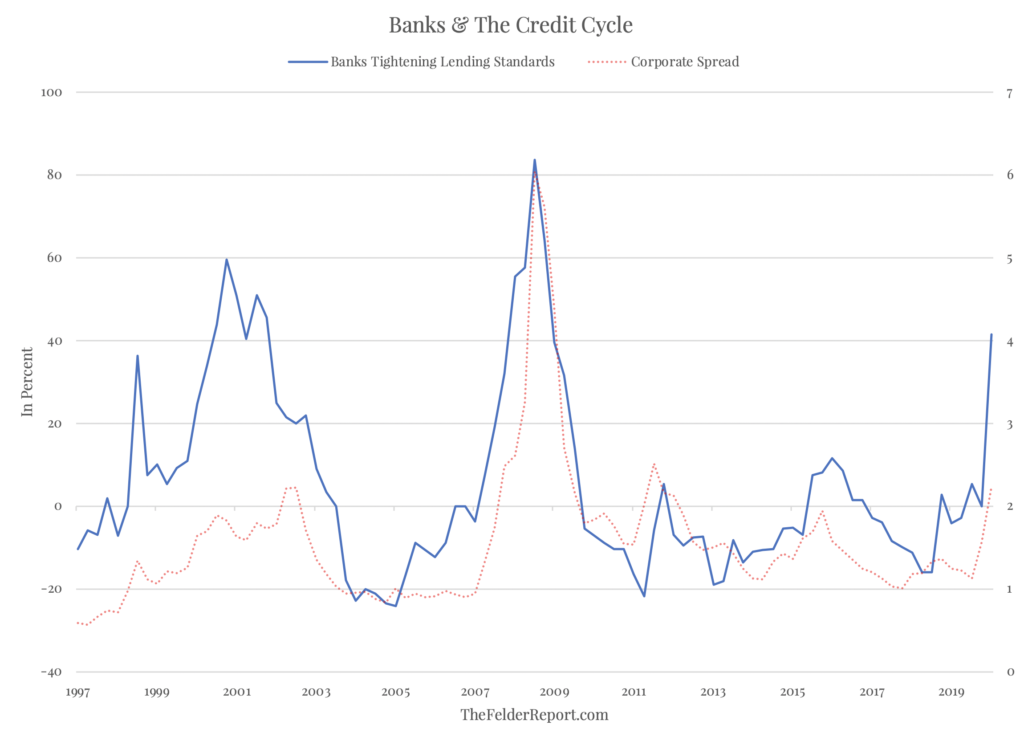
When the yield curve inverts, it squeezes the net interest margins of banks. After a long economic expansion, the banks have already lent a ton of money out and have very little reason to lend more at little to no profit so they begin to tighten lending standards.
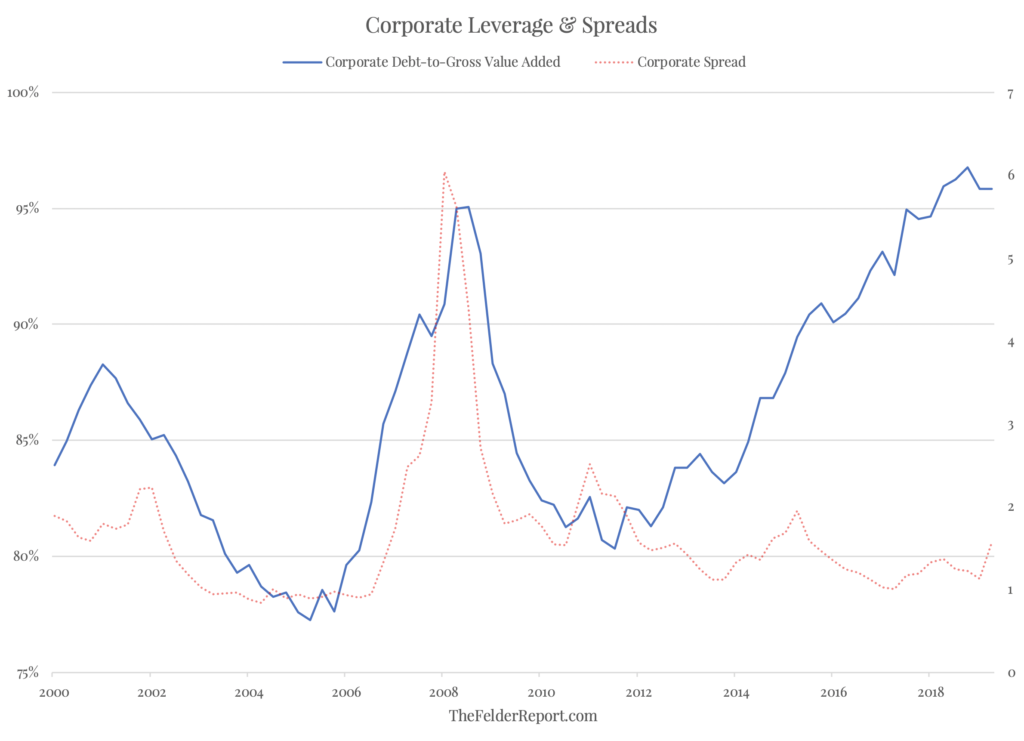
This tightening of lending standards so late in the credit cycle leads to a rise in corporate spreads as companies who have become over-leveraged begin to feel the pinch of a drying up of credit. This rising distress leads to even greater tightening of credit and the virtuous cycle that drove the credit markets becomes a vicious one. (Of course, rising distress can also lead to a tightening of credit but it’s really always a chicken or the egg-type of phenomenon.)
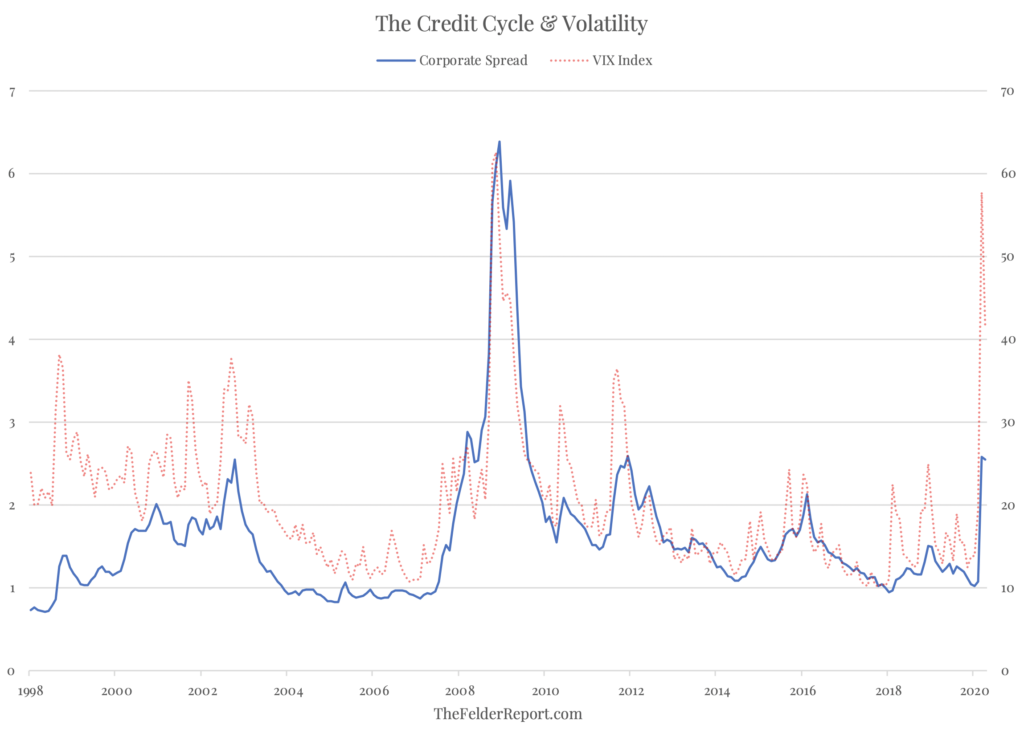
Furthermore, rising spreads are very highly correlated with rising equity volatility. This is due to the fact that equity investors are wiped out before debt holders so when credit issues arise equities usually fall even faster than corporate bonds do.
And because this credit cycle has seen corporate leverage rise to record highs, the potential for distress and thus rising spreads is still very significant. In fact, the uptick in spreads we have seen so far this year is not nearly commensurate with the amount of corporate debt that could possibly become problematic over the next several quarters as the current recession progresses.
Thus, volatility in the equity market is very likely only just beginning rather than ending as many market participants seem to be discounting during the recent rally. The relationship between the yield curve and the VIX suggests we could see another two or three years of elevated volatility ahead of us.
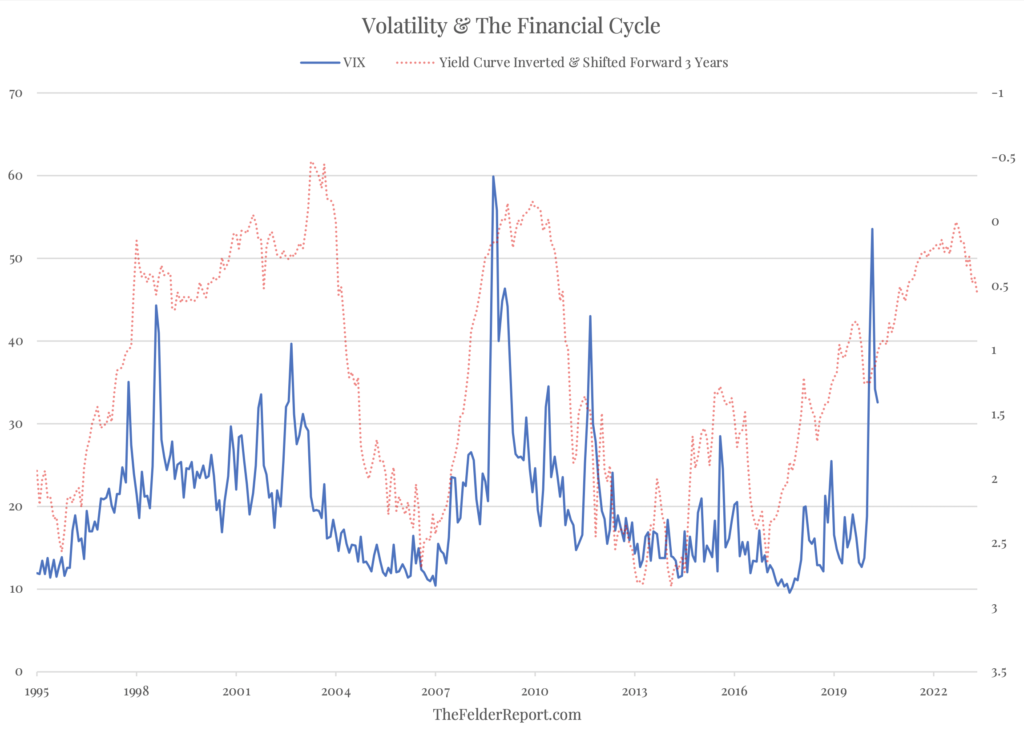 The bottom line is it appears the credit cycle has turned just as the yield curve suggested it would. What’s more, due to the massive amount of corporate debt issued over the past decade, mostly the result of the great debt-for-equity swap, another “Minsky Moment” may be approaching. If so, the volatility we just witnessed in the equity market in March was only just a preview of what’s to come.
